Download
1 / 33
330 likes | 422 Views
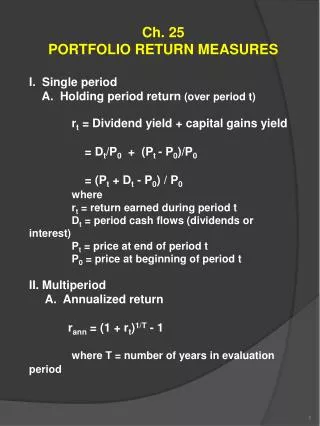
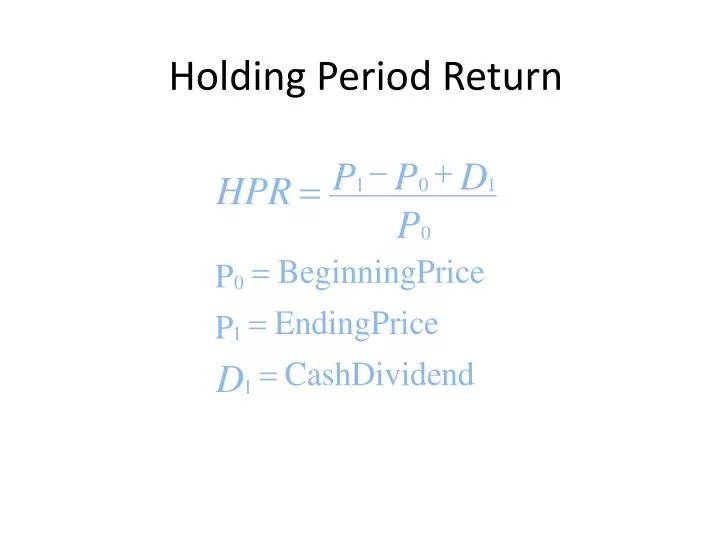
Holding Period Return. Rates of Return: Single Period Example. Ending Price = 24 Beginning Price = 20 Dividend = 1 HPR = ( 24 - 20 + 1 )/ ( 20) = 25%. Example 43.

E N D
Rates of Return: Single Period Example Ending Price = 24 Beginning Price = 20 Dividend = 1 HPR = ( 24 - 20 + 1 )/ ( 20) = 25%
Example 43 You purchased a share of stock for $20. One year later you received $2 as dividend and sold the share for $23. Your holding-period return was __________. A) 5 percent B) 10 percent C) 20 percent D) 25 percent The holding period return on a stock was 25%. Its ending price was $18 and its beginning price was $16. Its cash dividend must have been __________. A) $0.25 B) $1.00 C) $2.00 D) $4.00
Returns Using Arithmetic and Geometric Averaging Arithmetic ra = (r1 + r2 + r3 + ... rn) / n ra =.10 or 10% Geometric rg = {[(1+r1) (1+r2) .... (1+rn)]} 1/n - 1 rg = .0829 = 8.29%
Example 12 The arithmetic average of 12%, 15% and 20% is _________. A) 15.7% B) 15% C) 17.2% D) 20% The geometric average of 10%, 20% and 25% is __________. A) 15% B) 18.2% C) 18.3% D) 23%
Quoting Conventions APR = annual percentage rate (periods in year) X (rate for period) EAR = effective annual rate ( 1+ rate for period)Periods per yr - 1 Example: monthly return of 1% APR = EAR =
Characteristics of Probability Distributions 1) Mean: most likely value 2) Variance or standard deviation 3) Skewness * If a distribution is approximately normal, the distribution is described by characteristics 1 and 2
1 - 8 Return Variability: The Second Lesson
Example What range of return would you expect to see in 95% of time? Is it possible you can earn 65% return annually at 1% significant level?
S E ( r ) = p ( s ) r ( s ) s Measuring Mean: Scenario or Subjective Returns Subjective expected returns p(s) = probability of a state r(s) = return if a state occurs 1 to s states
Numerical Example: Subjective or Scenario Distributions StateProb. of State rin State 1 .1 -.05 2 .2 .05 3 .4 .15 4 .2 .25 5 .1 .35 E(r) =.15
S 2 Variance = p ( s ) [ r - E ( r )] s s Measuring Variance or Dispersion of Returns Subjective or Scenario Standard deviation = [variance]1/2 Using Our Example: Var=.01199 S.D.= [ .01199] 1/2 = .1095
Risk Premiums and Risk Aversion Degree to which investors are willing to commit funds Risk aversion If T-Bill denotes the risk-free rate, rf, and variance, , denotes volatility of returns then: The risk premium of a portfolio is: E(Rp) - Rf
Risk Premiums and Risk Aversion To quantify the degree of risk aversion with parameter A: E(Rp) – Rf = (1/2) A σp2
The Sharpe (Reward-to-Volatility) Measure Sharpe ratio = Portfolio risk premium/standard deviation of the excess returns = (E(Rp) – Rf)/σp
Annual Holding Period ReturnsFrom Table 5.3 of Text Geom. Arith. Stan. Series Mean% Mean% Dev.% World Stk 9.41 11.17 18.38 US Lg Stk 10.23 12.25 20.50 US Sm Stk 11.80 18.43 38.11 Wor Bonds 5.34 6.13 9.14 LT Treas 5.10 5.64 8.19 T-Bills 3.71 3.79 3.18 Inflation 2.98 3.12 4.35
Figure 5.1 Frequency Distributions of Holding Period Returns
Real vs. Nominal Rates Fisher effect: Approximation nominal rate = real rate + inflation premium R = r + i or r = R - i Example r = 3%, i = 6% R = 9% = 3% + 6% or 3% = 9% - 6% Fisher effect: Exact r = (1+R) / (1 + i) - 1 2.83% = (9%-6%) / (1.06)
Allocating Capital Between Risky & Risk-Free Assets Possible to split investment funds between safe and risky assets Risk free asset: proxy; T-bills Risky asset: stock (or a portfolio) Risk premium: risk asset return-risk-free rate Issues Examine risk/ return tradeoff Demonstrate how different degrees of risk aversion will affect allocations between risky and risk free assets
rf = 7% srf= 0% E(rp) = 15% sp = 22% y = % in p (1-y) = % in rf Example:Given:
E(rc) = yE(rp) + (1 - y)rf rc = complete or combined portfolio For example, y = .75 E(rc) = .75(.15) + .25(.07) = .13 or 13% Expected Returns for Combinations
s Since = 0, then rf = y c p Variance on the Possible Combined Portfolios s s
If y = .75, then = .75(.22) = .165 or 16.5% c If y = 1 = 1(.22) = .22 or 22% c If y = 0 = 0(.22) = .00 or 0% c Combinations Without Leverage s s s
Using Leverage with Capital Allocation Line Borrow at the Risk-Free Rate and invest in stock Using 50% Leverage rc = (-.5) (.07) + (1.5) (.15) = .19 sc = (1.5) (.22) = .33 Reward-to-variability ratio = risk premium/standard deviation
Figure 5.5 Investment Opportunity Set with a Risk-Free Investment
Figure 5.6 Investment Opportunity Set with Differential Borrowing and Lending Rates
Risk Aversion and Allocation Greater levels of risk aversion lead to larger proportions of the risk free rate Lower levels of risk aversion lead to larger proportions of the portfolio of risky assets Willingness to accept high levels of risk for high levels of returns would result in leveraged combinations
Example 22 Consider the following two investment alternatives. First, a risky portfolio that pays 15% rate of return with a probability of 60% or 5% with a probability of 40%. Second, a treasury bill that pays 6%. The risk premium on the risky investment is __________. A) 1% B) 5% C) 9% D) 11% Consider the following two investment alternatives. First, a risky portfolio that pays 20% rate of return with a probability of 60% or 5% with a probability of 40%. Second, a treasury that pays 6%. If you invest $50,000 in the risky portfolio, your expected profit would be __________. A) $3,000 B) $7,000 C) $7,500 D) $10,000
Example 41 You have $500,000 available to invest. The risk-free rate as well as your borrowing rate is 8%. The return on the risky portfolio is 16%. If you wish to earn a 22% return, you should __________. A) invest $125,000 in the risk-free asset B) invest $375,000 in the risk-free asset C) borrow $125,000 D) borrow $375,000 The Manhawkin Fund has an expected return of 12% and a standard deviation return of 16%. The risk free rate is 4%. What is the reward-to-volatility ratio for the Manhawkin Fund? A) 0.5 B) 1.3 C) 3.0 D) 1.0
Example 422 You invest $100 in a complete portfolio. The complete portfolio is composed of a risky asset with an expected rate of return of 12% and a standard deviation of 15% and a treasury bill with a rate of return of 5%. __________ of your money should be invested in the risky asset to form a portfolio with an expected rate of return of 9% A) 87% B) 77% C) 67% D) 57% An investor invests 40% of his wealth in a risky asset with an expected rate of return of 15% and a variance of 4% and 60% in a treasury bill that pays 6%. Her portfolio's expected rate of return and standard deviation are __________ and __________ respectively. A) 8.0%, 12% B) 9.6%, 8% C) 9.6%, 10% D) 11.4%, 12% The expected return of portfolio is 8.9% and the risk free rate is 3.5%. If the portfolio standard deviation is 12.0%, what is the reward to variability ratio of the portfolio? A) 0.0 B) 0.45 C) 0.74 D) 1.35