Download
1 / 32
390 likes | 572 Views
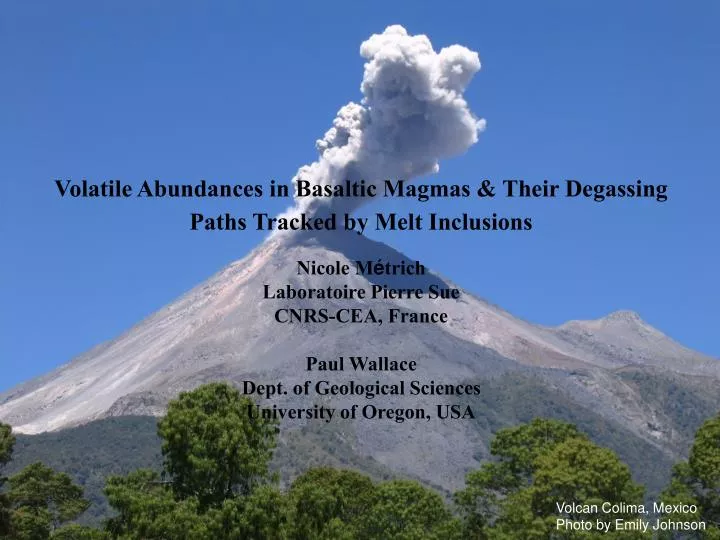
Volatile Abundances in Basaltic Magmas & Their Degassing Paths Tracked by Melt Inclusions Nicole M é t rich Laboratoire Pierre Sue CNRS-CEA, France Paul Wallace Dept. of Geological Sciences University of Oregon, USA. Volcan Colima, Mexico Photo by Emily Johnson. Outline.

E N D
Volatile Abundances in Basaltic Magmas & Their Degassing Paths Tracked by Melt Inclusions Nicole Métrich Laboratoire Pierre Sue CNRS-CEA, France Paul Wallace Dept. of Geological Sciences University of Oregon, USA Volcan Colima, Mexico Photo by Emily Johnson
Outline • Formation of melt inclusions & post-entrapment modification • Application of experimental volatile solubility studies to natural systems • The record of magma degassing preserved in melt inclusions & the effect of H2O loss on magma crystallization • Eruption styles and volatile budgets: information from melt inclusions • Unresolved questions & directions for future studies
What are melt inclusions & how do they form? • Primary melt inclusions form in crystals when some process interferes with the growth of a perfect crystal, causing a small volume of melt to become enclosed. • Formation mechanisms: 1. Skeletal or other irregular growth forms due to strong undercooling 2. Formation of reentrants (by resorption) followed by additional crystallization 3. Wetting of the crystal by an immiscible phase (e.g. sulfide melt or vapor bubble) or attachment of another small crystal (e.g. spinel on olivine) resulting in irregular crystal growth & inclusion entrapment • Melt inclusions can be affected by post-entrapment processes Roedder (1984); Lowenstern (1995)
Experimental & natural skeletal (hopper morphology) olivine with melt inclusions (faster cooling) Keanakakoi Ash 500 mm Paricutin, Mexico Faure & Schiano (2005) Experimental and natural polyhedral olivine with melt inclusions (slow cooling) 100 mm 100 mm Keanakakoi Ash, Kilauea, Hawaii Jorullo volcano, Mexico Faure & Schiano (2005)
Experimental and natural closed dendritic olivine with melt inclusions (very fast cooling) 100 mm Blue Lake Maar, Oregon Cascades Faure & Schiano (2005) Stromboli Volcano
Effect of Growth Rate on Trapped Melt Compositions Faure & Schiano (2005) Experiments in CMAS system. • Rapid growth morphologies have inclusions that are moderately to strongly enriched in Al2O3. • This is caused by boundary layer enrichment due to slow diffusion of Al2O3 relative to CaO.
Differences between Experimental & Natural Melt Inclusions Data from Johnson et al. (2008) • Most natural melt inclusions show no evidence of anomalous enrichment in slowly diffusing elements, even in small inclusions and rapid growth forms like skeletal or hopper crystals. • Volatile components have faster diffusivities than Al2O3 and thus should not generally be affected by boundary layer enrichment effects.
Cooling Inclusion entrapment Crystallization along melt – crystal interface Crystal Fe Shrinkage vapor bubble Melt inclusion Post-Entrapment Modification of Melt Inclusions Diffusive loss of H2 or molecular H2O • Diffusive loss of H-species • Should be limited to <1 wt% H2O by redox equilibria & melt FeO • if loss occurs by H2 diffusion (Danyushevsky, 2001). • Leaves distinct textural features – magnetite dust – from oxidation. • Possible rapid diffusion of molecular H2O (Almeev et al., 2008).
Review of Experimentally Measured Solubilities for Volatiles Some key things to remember: • Volatiles occur as dissolved species in silicate melts & also in a separate vapor phase if a melt is vapor saturated. • In laboratory experiments, melts can be saturated with a nearly pure vapor phase (e.g., H2O saturated). • In natural systems, however, multiple volatile components are always present (H2O, CO2, S, Cl, F, plus noble gases, volatile metals, alkalies, etc.). • When the sum of the partial pressures of all dissolved volatiles in a silicate melt equals the confining pressure, the melt becomes saturated with a multicomponent (C-O-H-S-Cl-F-noble gases, etc.) vapor phase. • Referring to natural magmas as being H2O saturated or CO2 saturated is, strictly speaking, incorrect because the vapor phase always contains other volatiles.
Solubilities with 2 Volatile Components Present Solid lines show solubility at different constant total pressures Dashed lines show the vapor composition in equilibrium with melts of different H2O & CO2 From Dixon & Stolper (1995) • H2O and CO2 contribute the largest partial pressures, so people often focus on these when comparing pressure & volatile solubility
Ca,Mg-bearing carbonates Arc basalts (Wallace 2005) Estimating Vapor-Saturation Pressures for Melt Inclusions Total vapor pressure (PH2O+PCO2) for an inclusion can be calculated assuming: • Vapor saturation – how do we know melts were vapor saturated? – Large variations in ratios of bubble volume to inclusion volume – Presence of dense CO2 liquid in bubbles – Homogenization not possible in heating experiments • No post-entrapment loss of CO2 or H2O to bubbles, no leakage, no H2O diffusive loss. •CO2 lost to bubbles lowers vapor saturation pressure. Carbonate crystals lining bubble walls CO2 diffuses into a shrinkage bubble during cooling • CO2 loss demonstrated in heating experiments on olivine (Fo88) from a Mauna Loa picrite. • Melt inclusions re-homogenized at 1400°C for <10 min. • As much as 80% of the initial CO2 can be transferred to a shrinkage bubble over a cooling interval of ~ 100°C. Etna 2001,2002 Etna 3900 BP eruption Melt inclusions (12-14wt% MgO) in olivine Fo91 (Kamenetsky et al., Geology 2007) Cervantes et al., (2002)
Chlorine Solubility in Basaltic Melts 2 kbar Vapor saturated Continuous transition from vapor to hydrosaline melt as Cl concentration in vapor (% values) rapidly increases H2O (wt%) Hydrosaline melt (brine) saturated From Webster et al., (1995) Cl (wt%) • In this simplified experimental system, basaltic melts are either saturated with H2O-Cl vapor or molten NaCl with dissolved H2O (hydrosaline melt) • Natural basaltic melts typically have <0.25 wt% Cl.
Sulfur Solubility • Sulfur solubility depends on temperature, pressure, melt composition & oxygen fugacity. • Thermodynamic model of Scaillet & Pichavant (2004) relates these variables to fS2. Jugo et al. (2005) Basalt Trachyandesite Sulfide saturated Sulfate saturated • Changes in fO2 have a strong effect on solubility because S6+ is much more soluble than S2-.
The record of magma degassing preserved in melt inclusions & the effect of H2O loss on magma crystallization Popocatépetl, Mexico
H2O and CO2 Variations in Basaltic Melt Inclusions Closed-system degassing Exsolved gas remains entrained in melt & maintains equilibrium. Open-system degassing Exsolved gas is continuously separated from melt Closed Open Melt inclusions from Keanakakoi Ash, Kilauea, Hawaii (Hart & Wallace, unpublished) • Melt inclusion data from a single volcano or even a single eruptive unit often show a range of H2O and CO2 values. • In most cases, this range reflects variable degassing during ascent before the melts were trapped in growing olivine crystals (i.e., polybaric crystallization)
H2O and CO2 Contents of Basaltic Magmas Wallace (2005) • • Olivine-hosted melt inclusion pressure estimates rarely exceed ~400 MPa. • • In contrast, CO2-rich fluid inclusions commonly indicate higher pressures (Hansteen & Klügel). • As much as 90% of the initial dissolved CO2 in melts is lost when they reach crustal depths. • Melt inclusion CO2 provides information on degassing & crystallization processes. • H2O, S and Cl are much more soluble than CO2, and give information on degassing paths and the primary volatile contents of basaltic magmas & their mantle sources.
Open-system degassing Closed-system degassing: Exsolved gas remains entrained in melt & maintains equilibrium. ! Studies of melt inclusions from basaltic tephra from explosive volcanic activity (e.g., lava fountains, strombolian activity) often show significant H2O loss that cannot be strictly explained by pure open- or closed-system degassing of magmas Open-system degassing[Exsolved gas is continuously separated from melt] Strong decrease of CO2 and negligible H2O loss until the melt reaches vapor saturation pressure for pure H2O • Mariana Trough samples • Melt inclusions: CO2 = 875 141 ppm • Host glasses: CO2 = 18 5 ppm • Comparable H2O concentrations • 2.230.07 vs 2.120.10 wt% Newman et al., 2000 G-cubed1
Closed-system degassing and gas fluxing Closed system ascent of magma coexisting with a CO2-rich gas phase at 400 MPa Photos: P. Allard Etna : 2002 Lava fountain activity CO2 diffusion in bubble Spilliaert et al. 2006 JGR Volatilecalc (Newman & Lowenstern 2002) computations assuming equilibrium conditions Etna (Sicily) 2002 flank eruption Etna 2002 Both major and trace elements of natural inclusions in Fo~82, match those of the basalt-trachybasalt bulk-rocks Bulk rocks Melt inclusions Not a pure closed-system degassing a two-stage (multi-stage) process? Métrich et al., 2007
Closed-system degassing and gas fluxing 2.6 wt% H2O 1175 ppm CO2 2.7 wt% H2O 1140 ppm CO2 CO2-flushed magma ponding zone Enhanced magma dehydration Spilliaert et al., 2006, JGR • Combined effect of open-system addition of CO2-rich gas to ascending/ponding magma • Consistency with high CO2 in primary magmas (e.g. Kilauea, Gerlach et al., 2002; Etna, Allard et al., 1999),high CO2 flux at basaltic volcanoes (Fisher & Marty 2005; Wallace 2005 for reviews), high CO2/SO2 ratio in gas emissions with increasing explosivity of eruption (e.g. Burton et al., 2007; Aiuppa et al. 2007) • if true such a process should be the common case at open-conduit basaltic volcanoes • Effect of disequilibrium degassing (Gonnermann & Manga 2005) -Need more data on diffusion of CO2 relative to H2O(see Baker et al., 2005) • Need more data on natural samples combined with experiments on disequilibrium degassing
Closed-system degassing and gas fluxing 300 200 150 CSD 1% 100 CSD 2% 50 20 Wade et al. 2006 In both cases, the highest CO2 and H2O contents are preserved in M.I .hosted in Mg-rich olivines Volatilecalc computations assuming equilibrium conditions Irazù volcano (Costa Rica) - 1763 & 1963-65 eruptions: Closed-system degassing (CSD 2%), coupled with ascent, crystallization and cooling (1075-1045°C)(Benjamin et al. 2007, JVGR,168, 68-92) - Natural M.I. in (1 mm) olivine Fo87-79; with, on average, cp host scoria (54wt% SiO2; Ba/La = 17-20) Arenal volcano (Costa Rica) - pre-historic eruptions: Closed-system degassing (CSD 1%) coupled with fractionation and ascent from 2 to 0.2 kbars(Wade et al. 2006, JVGR,157, 94-120) - Natural M.I. in 0.25-1 mm size olivine with Fo79ol-wr bulk equilibrium Not a pure closed-system degassing CO2-rich gas fluxing
Gas fluxing, H2O loss and crystallization Jorullo (Mexico) monogenic basaltic cinder cone Central part of the subduction-related Trans-Mexican Volcanic Belt Johnson et al., 2008 , EPSL 269 Phase diagram for early Jorullo melt composition (10.5 wt.% MgO) constructed using MELTS (Ghiorso & Sack,1995; Asimow & Ghiorso,1998) and pMELTS (Ghiorso et al., 2002). High MgO, high H2O M.I. in Fo88-91 Minimum pressure of olivine formation 400 MPa At 400MPa - H2O-undersaturated melt Total pressure > 200MPa - Melt interaction with CO2-rich gas CO2-rich gas fluxing depletes melt in H2O and thereby causes olivine crystallization
H2O loss and crystallization Jorullo (Mexico) monogenic basaltic cinder cone Johnson et al., 2008 , EPSL 269 • Crystallization recorded by melt inclusions mainly driven by H2O loss during magma ascent • At 400-200 MPa: Water loss likely due to gas fluxing – olivine crystallization • At low pressure: CO2-depleted melts lose H2O by its direct exsolution in the vapor phase
H2O loss and crystallization • Melt inclusion studies provide evidence for crystallization driven by H2O loss • (+ cooling) at many volcanoes. • Message can be difficult to decipher because of additional processes such as: - Mixing involving degassed and undegassed magmas (Popocatépetl & Colima; Atlas et al., 2006) - Mingling (e.g. Fuego, Roggensack 2001) - Assimilation (Paricutin, Lurh 2001; Jorullo, Mexico, Johnson et al., 2008) • A case of efficient control of H2O degassing on magma crystallization is Stromboli - an open conduit volcanoe with low magma production rate and high degassing excess - where magmas share same chemical composition but have contrasting textures, crystal abundances (<10-50%) and viscosities (Métrich et al., 2001, Landi et al., 2004; Bertagnini et al., 2003, 2008)
Sulfur and halogen degassing Sulfide saturation Irazù:Benjamin et al. 2007, JVGR,168, 68-92 Arenal: Wade et al. 2006, JVGR,157, 94-120 Etna: Spilliaert et al., 2006, EPSL, 248, 772-786 • 80% S is lost between 140 and 10 MPa, whereas Cl starts degassing at low pressure (Ptot<20-10MPa) and F at Ptot<10MPa ? • Sulfur starts degassing at pressure (~150 MPa) in oxidized magmas in which sulfur is dissolved as sulfate > submarine sulfide-saturated basalts (Dixon et al., 1991)
Eruption styles and degassing budget Information from melt inclusions What are the recent improvements? Stromboli - 2006
Volatile budget for basaltic fissure eruptions DS= CS(M.I.) – CS(res) Petrologic estimates of the sulfur output Pre-requisite: no differential transferofgas CS(M.I.): S content in primitive melt (melt inclusion) CS(res.) : Residual S content in bulk lava or in matrix glass corrected for crystallization Wallace 2005, JVGR • Predicted relationship between SO2 emissions and eruptive magma volume assuming that SO2 released during eruption is provided by the sulfur dissolved in silicate melt Compared to sulfur emissions measured by independent methods as ulraviolet correlation spectrometer (COSPEC), atmospheric turbidity and Total Ozone Mapping Spectrometer (TOMS) • Uncertainties in SO2 emission data are generally considered to be about 30% for the TOMS data and 20–50% for COSPEC. Basalt: LK: Laki 1783-84 eruption; K: Kilauea, annual average; ML Mauna Loa; PC Pacaya 1972 eruption; St: Stromboli annual average
Volatile budget for basaltic fissure eruptions Melt inclusions Eldgjà [2] Laki [1] p-tephra* s-tephra lava [1,3] Thordarson &Self: (1993) Bull Vocanol 93 and (1996) JVGR 74; [2] Thordarson et al., (2001), JVGR, 108 *p-tephra : quenched melts indicative of magma degassing during during ascent • M.I. and W.R. have comparable composition • >95% of initial sulfur released • Sulfur partly exsolved in gas phase during magma ascent at shallow depth prior to eruption 75% escaped at vents, lofted by the eruptive column (strong fire fountaining) to 5-15 km altitudes at the beginning of each eruptive phase and 25% during the lava flowing Approach used for assessing the impact of large flood basalts on the atmosphere (Self et al; 2008 Science)
Volatile budget for basaltic fissure eruptions • The 94 days long flank eruption that occurred in 2002 at Mt Etna: • Modelling of the pressure related behavior of sulfur at Etna (2002 eruption) ~80% sulfur released in the gas phase during magma ascent (between 140 and 10 MPa) in agreement with conclusions drawn by Self, Thordarson and co-authors • SO2 flux:6.9108 kg (Petrologic estimates, Spilliaert et al. 2006) / 8.6108 kg (COSPEC, Caltabiano et al. 2006) • Comparable S/Cl molar ratio (~5) in vapor phase derived from melt inclusion data and measured in gas emissions no differential degassing of S (or Cl) Sulfur partly exsolved in gas phase during magma ascent at shallow depth without differential transfer of sulfur Consistency between petrologic estimates of SO2 budget and independent estimates (COSPEC or others) • Arenal (COSPEC 0.41 Mt of SO2 releasedsince 1968 ) Better agreement with COSPEC when considering the S content (>2000 ppm) of olivine-hosted melt inclusions representative of the undegassed basaltic andesitic magma rather than partly degassed melt trapped in Plag & Cpx Petrologic estimates even > COSPEC a part of sulfur could be lost? (Wade et al., 2007) Petrologic estimates commonly used for assessing the degassing budget of other volatiles in particular Cl and F
Differential transfer of gas bubbles – Excessive degassing Differential transfer of gas bubbles e.g. Jaupart et Vergniolle, 1988, Vergniolle, 1996; Philips and Wood 1998 • Excessive degassing at persistently active basaltic volcanoes such as: - Izu-Oshima in Japan (Kazahaya et al 1994) • Villarica in Chile (Witter et al., 2004), • Popocatepetl in Mexico (Delgado-Granados et al., 2001;Witter et al., 2005) -Etna&Stromboliin Italy (Allard., 1997; Burton et al., 2007) - Masaya in Nicaragua (Delmelle et al., 1999, Stix, 2007)…. • MI data used for assessing the mass (volume) of • unerupted magma when combined with gas flux measurements • Qm = SO2 /2DS • Qm : Mass flux of magma • 2DS = SO2 degassed from the magma • SO2 = SO2 flux measured by COSPEC or other techniques Stromboli Magma supply rate is assessed to be 0.001 km3 y-1, 154 higher than the magma extrusion rate Assuming 0.22 wt% S dissolved in magma as derived from M.I. <10% of magma is extruded given that quiescent degassing contributes to 95% total SO2 degassing (Allard et al., 2008)
Unresolved questions and directions for future studies Benbow (Ambrym, Vanuatu)
Most suitable melt inclusions for volatile studies quenched pyroclastites • Efforts dedicated in the last 15 years basic data for assessing: • the SO2 output from syn-eruptive degassing of basaltic magmas ascending in closed system conditions, with no differential gas transfer (gas loss) prior to eruption • the volume of non-erupted magma that has degassed in volcanic systems undergoing quiescent degassing • the degasssing paths of magmas • volatiles in arc magma mantle sources • Anew ideamagma fluxed by CO2-rich gas causing magma dehydration Question: Effect ofdisequilibrium degassing? • More data on basaltic melt inclusions in pyroxenes and comparison with data of olivine-hosted melt inclusions • Critical view of natural and experimental data on melt inclusions • Studies that include both melt inclusion & fluid inclusion analysis from the same samples
Efforts to improve the modeling of: • CO2-H2O evolution during decompression: • - experimental and thermodynamic data on the solubility of CO2 in H2O-bearing basaltic melts • more data on natural systems during well monitored eruptions allowing the combination of MI data with gas emission chemistry & seismic records • Magma ascent in the conduitsby combining M.I. data with matrix textures & bubble distribution • Integrating melt inclusion data with • Accurate studies of their host olivines and the mineralogy of the host magmas • Experimental data on volatile solubility • Degassing models that include both thermodynamic and physical aspects • Field work (gas measurements, acoustic and seismic) • is a necessity and represents a main challenge for the next few years. VGP special session: Model solubility, diffusive bubble growth, disequilibrium degassing, conduit processes Monday 15 December, 16h00, Oral session V14a, MC 3003 Tuesday 16 December, Poster session V21B, MC Hall D