Download
1 / 41
470 likes | 1.5k Views
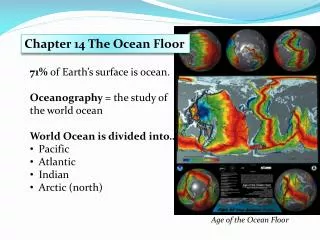
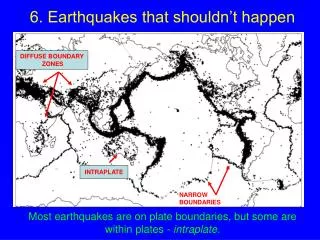
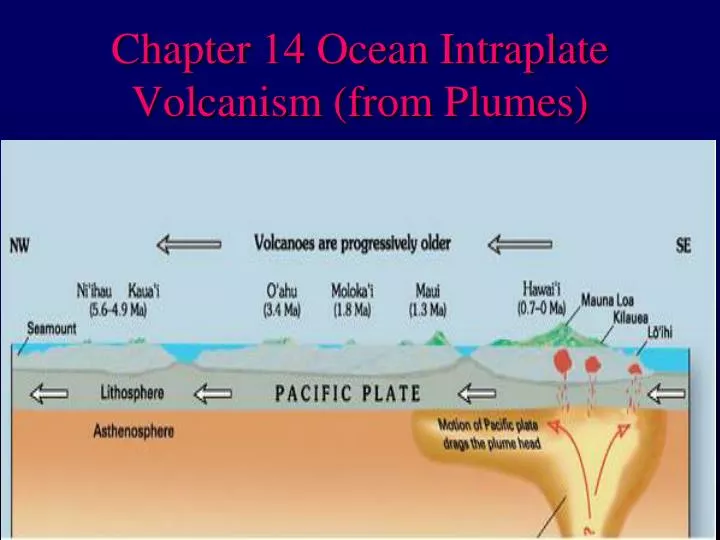
Chapter 14 Ocean Intraplate Volcanism (from Plumes). Ocean islands and seamounts Commonly associated with hot spots. Figure 14-1. After Crough (1983) Ann. Rev. Earth Planet. Sci., 11, 165-193. Ocean islands and seamounts Commonly associated with hot spots. Types of OIB Magmas.

E N D
Ocean islands and seamounts Commonly associated with hot spots Figure 14-1.After Crough (1983)Ann. Rev. Earth Planet. Sci., 11, 165-193.
Ocean islands and seamounts Commonly associated with hot spots
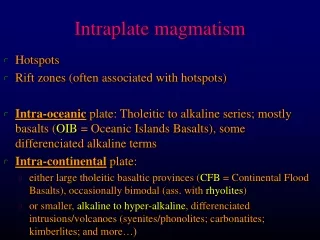
Types of OIB Magmas Two principal magma series • Tholeiitic series (dominant type) • Parental ocean island tholeiitic basalt, or OIT • Similar to MORB, but some distinct chemical and mineralogical differences • Alkaline series (subordinate) • Parental ocean island alkaline basalt, or OIA • Two principal alkaline sub-series • silica undersaturated • slightly silica oversaturated (less common series)
Tholeiitic and Alkaline examples • Modern volcanic activity of some islands is dominantly tholeiitic (for example Hawaii and Réunion). • Other islands are more alkaline in character (for example Tahiti in the Pacific and a concentration of islands in the Atlantic, including the Canary Islands, the Azores, Ascension, Tristan da Cunha, and Gough) Hawaii data, both tholeiitic and alkaline
Hawaiian Scenario Cyclic pattern to the eruptive history • 1. Pre-shield-building stage somewhat alkaline and variable • 2. Shield-building stage begins with tremendous outpourings of tholeiitic basalts This stage produces 98-99% of the total lava in Hawaii
Hawaiian Scenario 3. Waning activity more alkaline, episodic, and violent (Mauna Kea, Hualalai, and Kohala). Lavas are also more diverse, with a larger proportion of differentiated liquids 4. A long period of dormancy, followed by a late, post-erosional stage. Characterized by highly alkaline and silica-undersaturated magmas, including alkali basalts, nephelinites, melilite basalts, and basanites The two late alkaline stages represent 1-2% of the total lava output
Evolution in the Series Tholeiitic, alkaline, and highly alkaline Figure 14-2. After Wilson (1989) Igneous Petrogenesis. Kluwer.
Alkalinity is highly variable • Alkalis are incompatible elements, unaffected by less than 50% shallow fractional crystallization, this again argues for distinct mantle sources or generating mechanisms
Trace Elements • High Field Strength Elements (HFS or HFSE) elements (Th, U, Ce, Zr, Hf, Nb, Ta, and Ti) are also incompatible, and are enriched in OIBs > MORBs • Ratios of these elements are also used to distinguish mantle sources. For example: • The Zr/Nb ratio • N-MORBs are generally quite high (>30) • OIBs are low (<10)
Trace Elements • The large ion lithophile (LIL) trace elements (K, Rb, Cs, Ba, Pb2+ and Sr) are incompatible and are all enriched in OIB magmas with respect to MORBs • The ratios of incompatible elements have been employed to distinguish between source reservoirs • N-MORB: the K/Ba ratio is high (usually > 100) • E-MORB: the K/Ba ratio is in the mid 30’s • OITs range from 25-40, and OIAs in the upper 20’s Thus all appear to have distinctive sources
Trace Elements: REEs Note that ocean island tholeiites (OITs represented by the Kilauea and Mauna Loa samples) overlap with MORB and are not unlike E-MORB The alkaline basalts have steeper slopes and greater LREE enrichment than the OIT’s. Some fall within the upper MORB field, but most are distinct Figure 14-2. After Wilson (1989) Igneous Petrogenesis. .
Isotopes do not fractionate during partial melting of fractional melting processes, so will reflect the characteristics of the source OIBs, which sample a great expanse of oceanic mantle in places where crustal contamination is minimal, provide incomparable evidence as to the nature of the mantle Isotope Geochemistry
m Figure 14-6. After Zindler and Hart (1986), Staudigel et al. (1984), Hamelin et al. (1986) and Wilson (1989).
Mantle Reservoirs 1. DM (Depleted Mantle) = N-MORB source Figure 14.8.After Zindler and Hart (1986), Staudigel et al. (1984), Hamelin et al. (1986) and Wilson (1989).
2. BSE (Bulk Silicate Earth) or the Primary Uniform Reservoir Figure 14.8.After Zindler and Hart (1986), Staudigel et al. (1984), Hamelin et al. (1986) and Wilson (1989).
3. EMI = enriched mantle type I has lower 87Sr/86Sr (near primordial) 4. EMII = enriched mantle type II has higher 87Sr/86Sr (> 0.720), well above any reasonable mantle sources Figure 14.8.After Zindler and Hart (1986), Staudigel et al. (1984), Hamelin et al. (1986) and Wilson (1989).
5. PREMA (PREvalent MAntle) Figure 14.8. After Zindler and Hart (1986), Staudigel et al. (1984), Hamelin et al. (1986) and Wilson (1989).
Binary All analyses fall between two reservoirs as magmas mix Ternary All analyses fall within triangle determined by three reservoirs Figure 14.7. Winter (2001) An Introduction to Igneous and Metamorphic Petrology. Prentice Hall. Simple Mixing Models
Note that all of the Nd-Sr data can be reconciled with mixing of three reservoirs: DM EMI and EMII since the data are confined to a triangle with apices corresponding to these three components. So, what is the nature of EMI and EMII, and why is there yet a 6th reservoir (HIMU) that seems little different than the mantle array? Figure 14-6. After Zindler and Hart (1986), Staudigel et al. (1984), Hamelin et al. (1986) and Wilson (1989).
Pb is quite scarce in the mantle • Low-Pb mantle-derived melts susceptible to Pb contamination • Incompatibles U, Pb, and Th are concentrated in continental crust • 204Pb is non-radiogenic. • 208Pb/204Pb, 207Pb/204Pb, and 206Pb/204Pb increase as U and Th decay • Oceanic crust also has elevated U and Th content (compared to the mantle) • So are sediments derived from oceanic and continental crust • So Pb is a sensitive measure of crustal (including sediment) components contaminating mantle isotopic systems • 93.7% of natural U is 238U, so 206Pb/204Pb will be most sensitive to a crustal-enriched component 9-20 238U 234U 206Pb 9-21 235U 207Pb 9-22 232Th 208Pb
Figure 14-7. After Wilson (1989) Igneous Petrogenesis. Kluwer. 207Pb/204Pb vs. 206Pb/204Pb data for Atlantic and Pacific ocean basalts Geochron = simultaneous evolution of 206Pb and 207Pb in a rock/reservoir = line on which all modern single-stage (not disturbed or reset) Pb isotopic systems, such as BSE (Bulk Silicate Earth), should plot. ~Notice NONE of the oceanic volcanics fall on the geochron. Nor do they fall within the EMI-EMII-DM triangle, as they appear to do in the Nd-Sr systems. The remaining mantle reservoir: HIMU (high mu) proposed to account for this great radiogenic Pb enrichment pattern
m = 238U/204Pb (evaluate uranium enrichment) • HIMU reservoir: very high 206Pb/204Pb ratio • Source with high U, • yet not enriched in Rb (has modest 87Sr/86Sr) Old enough (> 1 Ga) to ® observed isotopic ratios • HIMU model: • Subducted and recycled oceanic crust (± seawater)
EMI and EMII • High 87Sr/86Sr require initially high Rb & long time to ®87Sr • Correlates with continental crust (or sediments derived from it) • Oceanic crust and sediment are other likely candidates
HIMU is also 208Pb enriched, so this reservoir is enriched in Th as well as U Dupré and Allègre (1983), Figure 14.10 After Wilson (1989) Igneous Petrogenesis. Kluwer. Data from Hamelin and Allègre (1985), Hart (1984), Vidal et al. (1984). 207Pb/204Pb data (especially from the N hemisphere) ® ~linear mixing line between DM and HIMU, a line called the Northern Hemisphere Reference Line (NHRL) Data from the southern hemisphere (particularly Indian Ocean) departs from this line, and appears to include a larger EM component (probably EMII)
Other isotopic systems that contribute to our understanding of mantle reservoirs and dynamics He Isotopes Noble gases are inert and volatile 4He is an alpha particle, produced principally by a-decay of U and Th, enriching primordial 4He 3He is largely primordial (constant) The mantle is continually degassing and He lost (cannot recycle back) 4He enrichment expressed as R = (3He/4He) Runusual among isotope expressions in that radiogenic is the denominator Common reference is RA (air) = 1.39 x 10⁻⁶
He Isotopes N-MORB is fairly uniform at 8±1 RA suggesting an extensive depleted (degassed) DM-type N-MORB source Figure 14.123He/4He isotope ratios in ocean island basalts and their relation to He concentration. Concentrations of 3He are in cm3 at 1 atm and 298K.After Sarda and Graham (1990) and Farley and Neroda (1998).
He Isotopes OIB 3He/4He values extend to both higher and lower values than N-MORBs, but are typically higher (low 4He). Simplest explanations: High R/RA is deeper mantle with more primordial signature Low R/RA has higher 4He due to recycled (EM-type?) U and Th. Figure 14.123He/4He isotope ratios in ocean island basalts and their relation to He concentration. Concentrations of 3He are in cm3 at 1 atm and 298K.After Sarda and Graham (1990) and Farley and Neroda (1998).
He Isotopes PHEM (primitive helium mantle) is a He3/He4 mantle end-member reservoir with near-primitive Sr-Nd-Pb characteristics. PHEM no longer exists due to radiogenic increases in 4He. Figure 14.133He/4He vs. a.87Sr/86Sr and b.206Pb/204Pb for several OIB localities and MORB. The spread in the diagrams are most simply explained by mixing between four mantle components: DM, EMII, HIMU, and PHEM. After Farley et al. (1992).
He Isotopes Summary Shallow mantle MORB source is relatively homogeneous and depleted in He OIBs have more primordial (high) 3He/4He, but still degassed and less than primordial (100-200RA) values, consistent with our deeper mantle ideas. Again, PHEM concept may be like that more primitive mantle reservoir, prior to natural increase in radiogenic He and contamination. Current Lower than PHEM 3He/4He in OIB’s may be due to recycled crustal U and Th
Re/Os system and Os Isotopes 187Re → 187Os Both are platinum group elements (PGEs) PGEs → core or sulfides depending on whether or not they are compatible. Os is compatible during mantle partial melting (goes into → solids as a trace in sulfides, so they don’t leave the mantle), but Re is moderately incompatible (goes into → melts and, eventually, crust silicates) The mantle is thus enriched in Os relative to crustal rocks and crustal rocks. Crustal rocks have higher Re and lower Os and develop a high (187Os/188Os) as Re decays, which should show up if crustal rocks are recycled back into the mantle. Re is Rhenium and Os is Osmium
Os Isotopes plus the FOZO All of the basalt provinces are enriched in 187Os due to high Re decaying, over the values in mantle peridotites and require more than one 187Os-enriched reservoir to explain the distribution. Crust is high (with little overlap to peridotites). 187Re → 187Os Figure 14.13187Os/188Os vs. 206Pb/204Pb for mantle peridotites and several oceanic basalt provinces. Os values for the various mantle isotopic reservoirs are estimates. After Hauri (2002) and van Keken et al. (2002b).
Other Mantle Reservoirs FOZO (focal zone): another “convergence” reservoir toward which many trends approach. Thus perhaps a common mixing end-member Figure 14.15. After Hart et al., 1992).
EMI, EMII, and HIMU: too enriched for any known mantle process...must correspond to crustal rocks and/or sediments • EMI • Slightly enriched • Deeper continental crust or oceanic crust • EMII • More enriched • Specially in 87Sr (Rb parent) and Pb (U/Th parents) • Upper continental crust or ocean-island crust • If the EM and HIMU = continental crust (or older oceanic crust and sediments), only ® deeper mantle by subduction and recycling • To remain isotopically distinct: could not have rehomogenized or re-equilibrated with rest of mantle
The Nature of the Mantle • N-MORBs involve shallow melting of passively rising upper mantle • → a significant volume of depleted upper mantle (DM which has lost lithophile elements to melts which ended in late fractionation rocks, and which has lost He). • OIBs seem to originate from deeper levels. • Major- and trace-element data → the deep source of OIB magmas (both tholeiitic and alkaline) is distinct from that of N-MORB. • Trace element and isotopic data reinforce this notion and further indicate that the deeper mantle is relatively heterogeneous and complex, consisting of several domains of contrasting composition and origin. In addition to the depleted MORB mantle, there are at least four enriched components, including one or more containing recycled crustal and/or sedimentary material reintroduced into the mantle by subduction, and at least one (FOZO or PHEM) that retains much of its primordial noble gases. • MORBs are not as homogenous as originally thought, and exhibit most of the compositional variability of OIBs, although the variation is expressed in far more subordinate proportions. This implies that the shallow depleted mantle also contains some enriched components.
D dP S = Thus D dT V Mantle Questions • Is the mantle layered (shallow depleted and deeper non-depleted and even enriched)? • Or are the enriched components stirred into the entire mantle (like fudge ripple ice cream)? • How effective is the 660-km transition at impeding convective stirring? This depends on the Clapeyron slope of the phase transformation at the boundary! Pick any two points on an equilibrium curve dDG = 0 = DVdP - DSdT Clapeyron Eq.
No Effect Retards Penetration Enhances Penetration • → 2-Layer Mantle Model • → Whole-Mantle mixing Figure 14.16. Effectiveness of the 660-km transition in preventing penetration of a subducting slab or a rising plume
Case 1: dP/dT at 660 km is negative • Figure 1.14.Schematic diagram of a 2-layer dynamic mantle model • The 660 km transition is a sufficient density barrier to separate lower mantle convection • Only significant things that can penetrate this barrier are vigorous rising hotspot plumes and subducted lithosphere • Subducted lithosphere sinks to become incorporated in the D" layer where they may be heated by the core and return as plumes). After Silver et al. (1988).
Case 2: dP/dT at 660 km is positive Figure14.17.Whole-mantle convection model with geochemical heterogeneity preserved as blobs of fertile mantle in a host of depleted mantle. Higher density of the blobs results in their concentration in the lower mantle where they may be tapped by deep-seated plumes, probably rising from a discontinuous D" layer of dense “dregs” at the base of the mantle. After Davies (1984) .
2-layer Model for Oceanic Magmatism Continental Reservoirs DM OIB EM and HIMU from crustal sources (subducted OC + CC seds) Figure 14-10. Nomenclature from Zindler and Hart (1986). After Wilson (1989) and Rollinson (1993).
Whole Mantle Model for Oceanic Magmatism Figure 14.19. Schematic model for oceanic volcanism. Nomenclature from Zindler and Hart (1986) and Hart and Zindler (1989).