Download
1 / 15
150 likes | 534 Views
Population substructure. Most organisms do not occupy a continuous range in time and space. Toads and roads. Panmictic A=a=p=q=0.5 initially What will happen to the frequency of A and a, assuming that both alleles are neutral and the toad population is finite?. Toads and roads.

E N D
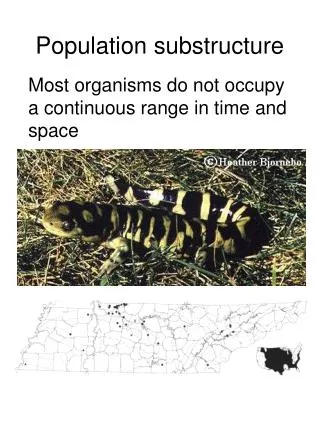
Population substructure Most organisms do not occupy a continuous range in time and space
Toads and roads • Panmictic • A=a=p=q=0.5 initially • What will happen to the frequency of A and a, assuming that both alleles are neutral and the toad population is finite?
Toads and roads • Panmixia within each subpopulation • A=a=p=q=0.5 initially in all subpopulations • What will happen to the frequency of A and a, assuming that both alleles are neutral and each toad subpopulation is finite?
Toads and roads Subpopulations can diverge in allele frequencies even if there is random mating within each subpopulation. This population differentiation is due to random genetic drift. The result of population subdivision is reduced heterozygosity and deviation from HWE among subpopulations.
Wright’s Fixation Index (FST) Sewall Wright 1889-1988
Hierarchical F statistics I = individual S = subpopulation T = total population (assumed panmictic) FIS can be thought of as: • F • Proportional loss of heterozygosity due to recent common ancestry FST can be thought of as: • Proportional loss of heterozygosity due to population subdivision and subsequent random genetic drift • Proportion of total genetic variance found among populations rather than within them FIT can be thought of as: • Proportional loss of heterozygosity due to recent common ancestry and population substructure
Hierarchical F statistics HI = observed heterozygosity (usually with molecular markers) averaged among individuals within a subpopulation HS = expected (HWE) heterozygosity for each subpopulation, averaged across all subpopulations (2pq) HT = expected (HWE) total heterozygosity based on allele frequency and without reference to any population substructure (2pq) FIS = (HS-HI)/HS FST = (HT-HS)/HT FIT = (HT-HI)/HT AA: p2 + pqFST Aa: 2pq – 2pqFST aa: q2 + pqFST
Hierarchical F statistics According to Sewall Wright: FST ranges from 0-1 • 0 = no genetic differentiation; panmixia • 0.00–0.05 = little genetic diff • 0.05-0.15 = moderate genetic diff • 0.15-0.25 = great genetic diff • 0.25-1.00 = very great genetic diff • 1 = complete genetic differentiation From Hamrick and Godt (1989)
Hierarchical F statistics According to Sewall Wright: FST ranges from 0-1 • 0 = no genetic differentiation; panmixia • 0.00–0.05 = little genetic diff • 0.05-0.15 = moderate genetic diff • 0.15-0.25 = great genetic diff • 0.25-1.00 = very great genetic diff • 1 = complete genetic differentiation From Hartl & Clark, Principles of Population Genetics
From Anne Chung www.apamsa.org/files/APAMSA%20presentation-general.ppt • Drugs metabolized by N-acetyltransferase • Nydrazid (anti-TB) • Sulfonamides (antibiotic) • Procanbid (antiarrhythmic) • Hydralzaine (antihypertensive) • Caffeine Price Evans DA. N-acetyltransferase in pharmacogenetics of drug metabolism. In Kalow W, ed. Pharmacogenetics of drug metabolism. International encyclopedia of pharmacology and therapeutics. New York: Pergamon Press, 1992: 43:95-178.
Racial differences in human populations • Why is this observation interesting to evolutionary biologists? • Why is this observation interesting to physicians and drug companies? • Why is this observation interesting (and contentious) to society? • What evolutionary and non-evolutionary mechanisms could explain this observation?
American Anthropological Association (Am Anthropol 1998; 100: 712-713) It has become clear that human populations are not unambiguous, clearly demarcated, biologically distinct groups. . . . Throughout history whenever different groups have come into contact, they have interbred. The continued sharing of genetic materials has maintained humankind as a single species. . . . Any attempt to establish lines of division among biological populations is both arbitrary and subjective.
Does “race” have biological meaning? • Is shared skin color a good surrogate for shared ancestry? • How could shared ancestry in human populations be determined?
How could shared ancestry in human populations be determined? • Is shared skin color a good surrogate for shared ancestry? • Can the genetic distance tree above be reconciled with the statement from the AAA? • Should human population structure be considered during drug development/testing? • What evolutionary and non-evolutionary mechanisms could explain variation in drug response among human populations?
Migration and FST At equilibrium, FST = 1/(4Nm + 1) What is Nm, in biological terms? What effect does migration have on population differentiation due to genetic drift?