Download
1 / 26
260 likes | 408 Views
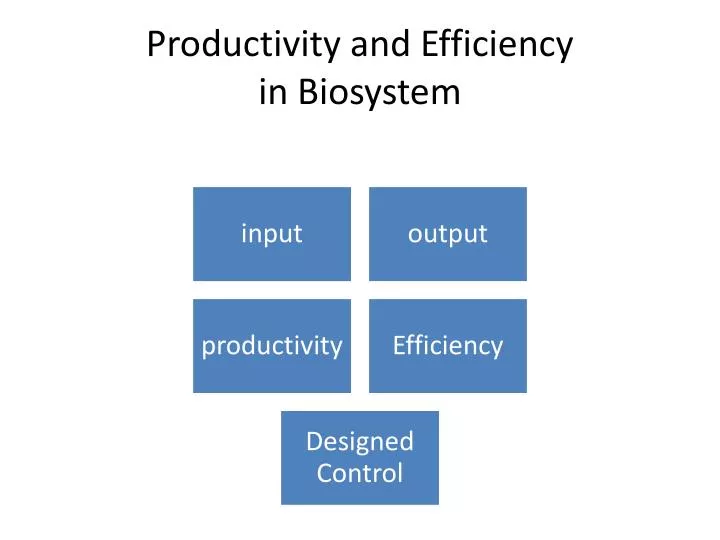
Productivity and Efficiency in Biosystem. Inputs and Outputs of Photosynthetic process . 6CO 2 + 6H 2 O + light energy >>> C 6 H 12 O 6 + 6O 2. Different plant s ( organisms) had different rate of production. The Flow of Energy: Primary Production to Higher Trophic Levels.

E N D
Inputs and Outputs of Photosynthetic process 6CO2 + 6H2O + light energy >>> C6H12O6 + 6O2 Different plant s ( organisms) had different rate of production
The Flow of Energy: Primary Production to Higher Trophic Levels Three hundred trout are needed to support one man for a year. The trout, in turn, must consume 90,000 frogs, that must consume 27 million grasshoppers that live off of 1,000 tons of grass. -- G. Tyler Miller, Jr., American Chemist (1971) "All flesh is grass." - Isaiah “We are all make up of dust of the earth” --anonymous
Gross Primary Production • On average, plant gross primary production on earth is about 5.83 x 10⁶ cal m-2 yr-1. This is about 0.06% of the amount of solar energy falling per square meter on the outer edge of the earth's atmosphere per year (defined as the solar constant and equal to 1.05 x 10¹⁰ cal m-2 yr-1).
Biological Productivity • * Gross Primary Production, GPP, is the total amount of CO2 that is fixed by the plant in photosynthesis. • * Respiration, R, is the amount of CO2 that is lost from an organism or system from metabolic activity. Respiration can be further divided into components that reflect the source of the CO2. • Rp=Respiration by Plants • Rh= Respiration by Heterotrophs • Rd= Respiration by Decomposers (the microbes)
NPP vs NEP • * Net Primary Production, NPP, is the net amount of primary production after the costs of plant respiration are included. Therefore, NPP = GPP - R* Net Ecosystem Production, NEP, is the net amount of primary production after the costs of respiration by plants, hetertrophs, and decomposers are all included. Therefore, NEP = GPP - (Rp + Rh + Rd) • A measure of Net Ecosystem Production is of great interest when determining the CO2 balance between various ecosystems, or the entire earth, and the atmosphere.
Why man become meat eater ? • Assimilation = (Ingestion - Excretion). The efficiency of this process of assimilation varies in animals, ranging from 15-50% if the food is plant material, and from 60-90% if the food is animal material.
Why we domesticated some plant & animal • These efficiencies vary among organisms, largely due to widely differing metabolic requirements. For instance, on average vertebrates use about 98% of assimilated energy for metabolism, leaving only 2% for growth and reproduction. On average, invertebrates use only ~80% of assimilated energy for metabolism, and thus exhibit greater net production efficiency (~20%) than do vertebrates. Plants have the greatest net production efficiencies, which range from 30-85%.
Ecological efficiency • Ecological efficiency is defined as the energy supply available to trophic level N + 1, divided by the energy consumed by trophic level N. You might think of it as the efficiency of hares at converting plants into fox food. In equation form for our example, the ecological efficiency = (fox production / hare production) Human population/ Food Production ? Maltusism Modern Agriculture
Metric Units ( wt) • Units: We will use the Pg or Pedagram of organic matter (= 1015 g, = 109 metric tons, = 1 "gigaton") (1 metric ton = 1,000 kg). An appreciation of metric unit please view Power of Ten ppt presentation
Feed Conversion • The conversion of assimilated energy into new tissue is termed secondary production in consumers, and it is conceptually the same as the primary production or NPP of plants
The "production" here refers to growth plus reproduction. In equation form, we have net production efficiency = (production / assimilation), or for plants = (NPP / GPP). These ratios measure the efficiency with which an organism converts assimilated energy into primary or secondary production.
Plant efficiency : Solar to carbon Energy • After the costs of respiration, plant net primary production is reduced to 4.95 x 10⁶ cal m-2 yr- 1, or about 0.05% of the solar constant. Note that this is the "average" efficiency, and in land plants this value can reach ~2-3% and in aquatic systems this value can reach ~1%. This relatively low efficiency of conversion of solar energy into energy in carbon compounds sets the overall amount of energy available to heterotrophs at all other trophic levels.
Biological productivity • How much of the sun's energy is available to and assimilated by plants, and how is that measured? • How are gross production, net production, and ecosystem production related? • How are standing crop, turnover rate, and net primary production related? • What types of ecosystems have the highest rates of production, and which make the biggest contributions to worldwide primary production? • What factors limit the amount of primary production locally and worldwide? • What is the efficiency with which energy is converted from trophic level to trophic level? • What are the differences between assimilation efficiency, net production efficiency, and ecological efficiency? • How do ecosystems differ in the amount of biomass or number of organisms present at any point in time, and generated over time, at each trophic level? • How much energy is available to humans, and how much do we use?
NPP • Only a fraction of the energy available at one trophic level is transferred to the next trophic level; the fractions can vary between 1-15%, with an average value of 10%. • Typically the numbers and biomass of organisms decreases as one ascends the food chain. • We can construct pyramids of biomass, energy, and numbers to represent the relative sizes of trophic levels in ecosystems. Pyramids can often be "inverted" as a consequence of high production rates at lower trophic levels. • The human diet is derived from plant material. Humans may consume, co-opt or make unavailable as much as 40% of the earth's total terrestrial NPP for food, land, and other uses. • Ecosystem function is controlled mainly by two processes, "top-down" and "bottom-up" controls.