Download
1 / 19
190 likes | 440 Views
Evaluating seawater intrusion at the regional scale in intensely exploited coastal aquifers . Katerina Mazi, G eorgia Destouni and Antonis Koussis Stockholm University National Observatory of Athens. NGL ANNUAL SCIENCE MEETING Oskarshamn , 7-8th of November 2013 .

E N D
Evaluating seawater intrusion at the regional scale in intensely exploited coastal aquifers Katerina Mazi, Georgia Destouni and AntonisKoussis Stockholm University National Observatory of Athens NGL ANNUAL SCIENCE MEETING Oskarshamn, 7-8th of November 2013
Causes of seawater intrusion in coastal aquifers • Heavy exploitation of coastal aquifers, especially in semi-arid regions, due to • Population concentration in coastal zones • Groundwater-based water supply • Intense economic activities, in particular agriculture. • Concerns due to climate change • Sea level rise • Decline of recharge. NGL ANNUAL SCIENCE MEETING, Oskarshamn, 2013
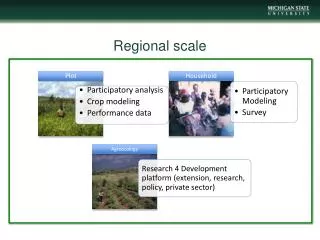
Modellingcharacteristics • Regional-scale analysis • 1st order vulnerability assessments • Sharp-interface analytical solution Comparison of analytical sharp-interface solution to SUTRA results: Example application to the Akrotiri Aquifer, Cyprus NGL ANNUAL SCIENCE MEETING, Oskarshamn, 2013
recharge recharge recharge recharge recharge groundwater extraction groundwater extraction sea sea sea sea sea inland boundary outflow outflow outflow outflow outflow fresh groundwater fresh groundwater fresh groundwater fresh groundwater Hsea Full seawater intrusion intruding seawater intruding seawater intruding seawater intruding seawater toe inclined aquifer base - impervious Zone of fresh water flow l Zone of interface flow Zone of fresh water flow Zone of interface flow Zone of fresh water flow Zone of interface flow NGL ANNUAL SCIENCE MEETING, Oskarshamn, 2013
Tipping points Thresholds beyond which seawater intrusion shifts abruptly from a stable state of moderate seawater intrusion and mild change responses to stresses, to a new stable state of complete seawater intrusion into the coastal aquifer. Mazi et al., 2013 NGL ANNUAL SCIENCE MEETING, Oskarshamn, 2013
Generalized analytical 1-D sharp-interface model K Koussis et al., 2012 NGL ANNUAL SCIENCE MEETING, Oskarshamn, 2013
Limiting condition: lT/lw= 1 recharge aquifer boundary qw sea gw divide well Hsea l toe zone of fresh water flow zone of interface flow Well intrusion NGL ANNUAL SCIENCE MEETING, Oskarshamn, 2013
Limiting condition: lT/lDIV= 1 recharge aquifer boundary qw sea gw divide well Hsea l toe zone of fresh water flow zone of interface flow Complete aquifer intrusion NGL ANNUAL SCIENCE MEETING, Oskarshamn, 2013
Performance curves and limiting conditions For analysing the resilience/vulnerability of different coastal aquifers to seawater intrusion, we developed performance curves,thatshow how the toe of the interface changes depending on the discharge conditions in the aquifer. NGL ANNUAL SCIENCE MEETING, Oskarshamn, 2013
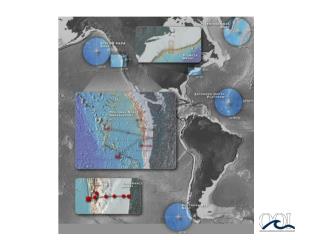
Intensely exploited regional Mediterranean aquifers NGL ANNUAL SCIENCE MEETING, Oskarshamn, 2013
Nile Delta Aquifer (1) Middle Nile Delta slope of impervious aquifer base sinφ = 0.003 head at the inland boundary = 14 m K = 100 m/d aquifer length = 175 km aquifer depth at the coastline = 740 m net recharge rate = 10 mm/yr East Nile Delta slope of impervious aquifer base sinφ = 0.004 head at the inland boundary = 14 m K = 120 m/d aquifer length = 180 km aquifer depth at the coastline = 910 m net recharge rate = 10 mm/yr (2) NGL ANNUAL SCIENCE MEETING, Oskarshamn, 2013
Nile Delta Aquifer – Performance curves Current pumping: 2.4 billion m3/yr pumping in the 90’s: 1.92 billion m3/yr pumping in the 50’s: 0 NGL ANNUAL SCIENCE MEETING, Oskarshamn, 2013
Nile Delta Aquifer - Results • The site-specific vulnerability assessments show that the advance of seawater currently seriously threatens the Nile Delta Aquifer. • The inland boundary head must here be sustained at any cost, as even a 10% decline will cause sea intrusion advancement by around 5-8 km and a 20% decline may bring the NDA to its tipping point of complete aquifer intrusion. NGL ANNUAL SCIENCE MEETING, Oskarshamn, 2013
Israel Coastal Aquifer Concept of Aquifer Model inclined impervious aquifer base sinφ = 0.01 no-flow inland boundary K = 30 m/d aquifer length = 20 km aquifer depth at the coastline = 200 m groundwater recharge rate = 240 mm/yr NGL ANNUAL SCIENCE MEETING, Oskarshamn, 2013
Israel Coastal Aquifer – Performance curves brackish water NGL ANNUAL SCIENCE MEETING, Oskarshamn, 2013
Israel Coastal Aquifer - Results • The current pumping location allows for a marginal increase of groundwater abstractions. • The maximum pumping could here be increased by about 20% if the pumping location were moved more inland, at least at lw = 5 km from the coast, thereby allowing a groundwater divide to form down-gradient. However, complete aquifer intrusion could occur if that maximum pumping rate were exceeded. NGL ANNUAL SCIENCE MEETING, Oskarshamn, 2013
A virtual Coastal Aquifer at the Baltic Sea – Performance curves max pumping: 3200 m3/m/yr max pumping: 4200 m3/m/yr Pumping at 3 km NGL ANNUAL SCIENCE MEETING, Oskarshamn, 2013
Comparison of performance curves for the Mediterranean and Baltic Sea aquifers lw/L 0.15 0.3 0.4 brackish water well intrusion complete intrusion Mediterranean aquifer Baltic Sea aquifer NGL ANNUAL SCIENCE MEETING, Oskarshamn, 2013
Concluding remarks • The generalized analytical sharp-interface model, with its simple yet realistic conceptualization of coastal aquifers, is suitable for first-order assessments of vulnerability to seawater intrusion. • Thus, aquifer management options in the Baltic, e.g. in the Oskarshamn region, could be explored and the exploitation limits and corresponding vulnerability to seawater intrusion could be assessed. • Furthermore, the detailed and reliable data that a research facility like NGL can provide could be used to field-test these model solutions in a controlled local setting. The combined local-regional test experience and the knowledge derived from it could be then transferred to coastal aquifers around the world. NGL ANNUAL SCIENCE MEETING, Oskarshamn, 2013