Download
1 / 34
340 likes | 450 Views
Salinity Intrusion: Integrating Riverine and Coastal Forces. Paul Conrads U . S. Geological Survey SC Water Science Center Columbia , SC . NIDIS Carolinas Pilot Project Scoping Workshop July 31, 2012. Outline. Conceptual model of salinity intrusion Look at some data

E N D
Salinity Intrusion: Integrating Riverine and Coastal Forces Paul Conrads U. S. Geological Survey SC Water Science Center Columbia, SC NIDIS Carolinas Pilot Project Scoping Workshop July 31, 2012
Outline • Conceptual model of salinity intrusion • Look at some data • Drought and salinity intrusion • Coastal drought index and data resource • Summary
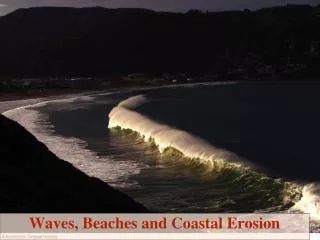
Freshwater Saltwater Short Review Salinity Dynamics Tidal Forcing mean water level, tidal range Riverine Flow “…estuaries may never really be steady-state systems; they may be trying to reach a balance they never achieve.” Keith Dyer, from Estuaries – A Physical Introduction (1997)
Saltwater-Freshwater Interface Low water levels High flows Tidal Marshes Critter Communities
Saltwater-Freshwater Interface High water levels Low flows Tidal Marshes Critter Communities
Freshwater Saltwater Example of Data: Yadkin-Pee Dee Basin Tidal Forcing mean water level, tidal range Riverine Flow Flow: Pee Dee River at Pee Dee Water level and Tidal Range: Atlantic Intracoastal Waterway at Little River Inlet Specific conductance (salinity): Waccamaw River the Hagley Landing
Freshwater Saltwater Example of Data: Streamflow Tidal Forcing mean water level, tidal range Riverine Flow
Freshwater Saltwater Example of Data: Water level Tidal Forcing mean water level, tidal range Riverine Flow Mean Water Level Two signals: Mean water level & Tidal Range Tide Range
Converging Conditions GAGE HEIGHTS AND FILTERED GAGES HEIGHT, FEET SPECIFIC CONDUCTANCE, UG/CM and FLOW, FT3/S
Looking Inside the Black Box • 3D response surfaces • Surface created by model • “Unseen” variables set to constant value • Manifestation of historical behavior of system • Insight to the process dynamics or physics
What Conditions Cause Large Intrusions? 3-D Response surface – Flow, Tidal Range, and Salinity Low water High water Salinity > Salinity > Tide range > Tide range > Flow > Flow > Low Coastal Water Level High Coastal Water Level
Freshwater Saltwater Savannah River • Riverine Flows • Savannah River at Clyo • Tidal Forcing • Mean Water level • Tidal Range • Fort Pulaski • Specific conductance • I-95
Flow and Drought Index Very quick look at South Carolina Coast Weekly drought index for Marion County Plot with 7-day average flow & 7-day average specific conductance
Flow and Drought Index D4 D3 D2 D1 0-D0
Specific Conductance and Drought Index D4 D3 D2 D1 0-D0
USGS Coastal Carolina Real-time Network ~50 active gages: Parameters: water level, sp. cond., temperature, dissolved oxygen, turbidity, pH, and/velocity
Summary • Salinity dynamics results of flow and coastal water interaction • Salinity intrusion events caused by convergence of conditions • Potential of a salinity coastal drought index • Real-time data networks available to support potential coastal drought index
Paul Conrads USGS South Carolina Science Center pconrads@usgs.gov
Fast Forward FERC Re-licensing
Freshwater Saltwater Example of Data: Streamflow Tidal Forcing water level, tidal range Riverine Flow
Orbital Mechanics and Tide Range Neap Tides Spring Tides