Download
1 / 20
210 likes | 276 Views
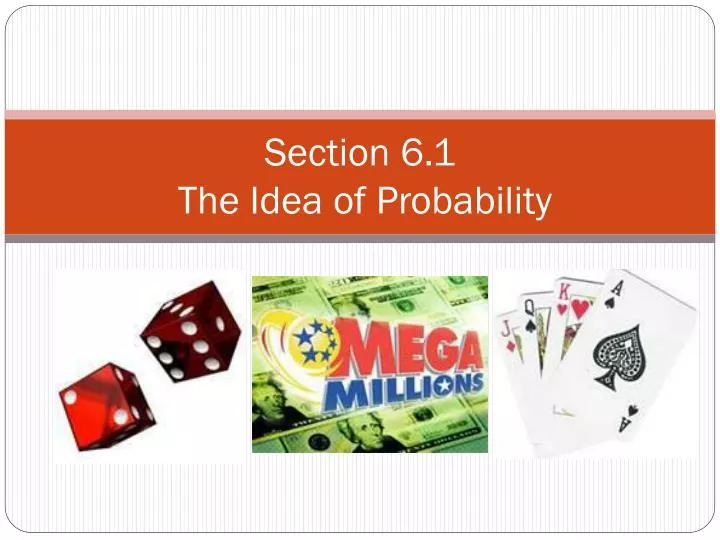
Section 6.1 The Idea of Probability. Section 6.1.

E N D
Section 6.1 Chance is all around us. Sometimes chance results from human design, as in the casino’s games of chance and the statistician’s random samples. Sometimes nature uses chance, as in choosing the sex of a child. Sometimes the reasons for chance behavior are mysterious, as when the number of deaths each year in a large population is as regular as the number of heads in many tosses of a coin. Probability is a branch of mathematics that describes the pattern of chance outcomes.
Section 6.1 TOSS A COIN Toss a coin 5 times and record how many times you get heads. Toss the coin 25 more times and record how many times you get heads out of the 30 trials. Toss the coin a total of 100 times and record how many times you get heads out of the 100 trials. Add the totals for the entire class. Discuss any observations.
Section 6.1 The mathematics of probability begins with the observed fact that some phenomena are random. That is, the relative frequencies of their outcomes seem to settle down to fixed values in the long run. Consider tossing a single coin. The relative frequency of heads is quite erratic in 2 or 5 or 10 tosses. But after several thousand tosses it remains stable, changing very little over further thousands of tosses. The big idea is this: Chance behavior is unpredictable in the short run but has a regular and predictable pattern in the long run.
Section 6.1 “Random” in statistics is not a synonym for “haphazard”, but a description of a kind of order that emerges only in the long run. Randomness and Probability We call a phenomenon random if individual outcomes are uncertain but there is nonetheless a regular distribution of outcomes in a large number of repetitions. The probability of any outcome of a random phenomenon is the proportion of times the outcome would occur in a very long series of repetitions. That is, probability is long-term relative frequency.
Section 6.1 • Thinking About Randomness • You must have a long series of independent trials. That is, the outcome of one trial must not influence the outcome of any other. • The idea of probability is empirical. Computer simulations start with given probabilities and imitate random behavior, but we can estimate a real-world probability only by actually observing many trials. • Nonetheless, computer simulations are very useful because we need long runs of trials. In situations, such as coin tossing, the proportion of an outcome often requires several hundred trials to settle down to the probability of that outcome. Short runs only give a rough estimate.
Section 6.1 The Law of Large Numbers As the number of repetitions of a probability experiment increases, the proportion with which a certain outcome is observed gets closer to the probability of the outcome. In probability, an experiment is any process that can be repeated in which the results are uncertain. A simple event is any single outcome from a probability experiment. Each simple event is denoted ei.
Section 6.1 The sample space, S, of a probability experiment is the collection of all possible simple events. In other words, the sample space is a list of all possible outcomes of a probability experiment. An event is any collection of outcomes from a probability experiment. An event may consist of one or more simple events. Events are denoted using capital letters such as E. The probability of an event, denoted P(E), is the likelihood of that event occurring.
Section 6.1 A bag contains 6 blue marbles, 3 red marbles, 4 green marbles, and 4 white marbles. You are interested in finding out the probability of drawing out a red marble. Identify the simple event in this question. What is the sample space? How would you write your question? Simple event—”drawing one red marble” Sample space– Blue, Red, Green, and White P(Red) = ???
Section 6.1 • Properties of Probabilities • The probability of any event E, P(E), must be between 0 and 1 inclusive. That is, • 0 <P(E) < 1. • 2. If an event is impossible, the probability of the event is 0. • 3. If an event is a certainty, the probability of the event is 1. • 4. If S = {e1, e2, …, en}, then • P(e1) + P(e2) + … + P(en) = 1.
Section 6.1 Three methods for determining the probability of an event: (1) the classical method (2) the empirical method (3) the subjective method
Section 6.1 Computing Probability Using the Classical Method If an experiment has n equally likely simple events and if the number of ways that an event E can occur is m, then the probability of E, P(E), is So, if S is the sample space of this experiment, then
Section 6.1 Computing Probabilities Using the Classical Method Suppose a “fun size” bag of M&Ms contains 9 brown candies, 6 yellow candies, 7 red candies, 4 orange candies, 2 blue candies, and 2 green candies. Suppose that a candy is randomly selected. (a) What is the probability that it is brown? (b) What is the probability that it is blue? (c) Comment on the likelihood of the candy being brown versus blue.
Section 6.1 Computing Probability Using the Empirical Method The probability of an event E is approximately the number of times event E is observed divided by the number of repetitions of the experiment.
Section 6.1 Computing Probability Using the Empirical Method The following data represent the number of homes with various types of home heating fuels based on a survey of 1,000 homes. (a) Approximate the probability that a randomly selected home uses electricity as its home heating fuel. (b) Would it be unusual to select a home that uses coal or coke as its home heating fuel?
Section 6.1 Computing Probability Using the Empirical Method
Section 6.1 Computing Probability Using the Empirical Method Using Simulation Simulate throwing a 6-sided die 100 times. Approximate the probability of rolling a 4. How does this compare to the classical probability?
Section 6.1 Subjective probabilities are probabilities obtained based upon an educated guess. For example, there is a 40% chance of rain tomorrow.
Section 6.1 The complement of any event A is the event A does not occur, written as . Probability Rule #5 The complement rule states that
Section 6.1 You have a standard deck of 52 cards. Let A = {red card} B = {black card} C = {heart} D = {spade} Find the following probabilities. P(A) = P(B) = P(Ac) = P(Bc) = P(C) = P(D) = P(Cc) = P(Dc) =