Download
1 / 10
100 likes | 237 Views
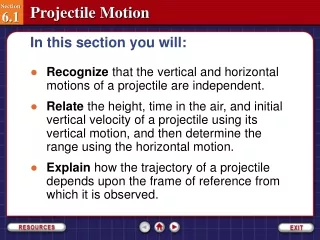
Section 6.1. Introduction to the Normal Distribution. With extra good stuff added by D.R.S., University of Cordele. Properties of a Normal Distribution. Properties of a Normal Distribution 1. A normal distribution is bell-shaped and symmetric about its mean.

E N D
Section 6.1 Introduction to the Normal Distribution With extra good stuff added by D.R.S., University of Cordele.
Properties of a Normal Distribution Properties of a Normal Distribution 1. A normal distribution is bell-shaped and symmetric about its mean. 2. A normal distribution is completely defined by its mean, m, and standard deviation, s. 3. The total area under a normal distribution curve equals 1. 4. The x-axis is a horizontal asymptote for a normal distribution curve.
The Standard Normal Distribution Properties of the Standard Normal Distribution 1. The standard normal distribution is bell-shaped and symmetric about its mean. 2. The standard normal distribution is completely defined by its mean, m = 0, and standard deviation, s = 1. 3. The total area under the standard normal distribution curve equals 1. 4. The x-axis is a horizontal asymptote for the standard normal distribution curve. The two things that make it “The Standard…”
Example 6.1: Calculating and Graphing z-Values Given a normal distribution with μ = 48 and s = 5, convert an x-value of 45 to a z-value and indicate where this z-value would be on the standard normal distribution. Solution Begin by finding the z-score for x = 45 as follows. TI-84 Needs Extra Parentheses around complicated numerator (unless your MODE is set to MathPrint, rather than Classic)
Recommend two parallel axes, z and x both RECOMMENDED: Sketch a normal distribution
Recommend two parallel axes, z and x both RECOMMENDED: Sketch a normal distribution A z-axis, labelingz = 0 and z = +1, -1, +2, -2, +3, -3, etc., as needed. For this particular problem, z = -1 and z = +1 are good to visualize, and z = -0.60 is meaningful.
Recommend two parallel axes, z and x both RECOMMENDED: Sketch a normal distribution A z-axis, labelingz = 0 and z = +1, -1, +2, -2, +3, -3, as needed. An x-axis, too, labeling the mean and other key values Observe the correspondence between z values and x values. Corresponding to those fourz-values are these four x-values.
Recommend two parallel axes, z and x both RECOMMENDED: Sketch a normal distribution A z-axis, labelingz = 0 and z = +1, -1, +2, -2, +3, -3, as needed. An x-axis, too, labeling the mean and other key values. Observe the correspondence between z values and x values. It’s clear to the reader that for x=45, z=-0.60. It’s clear to the reader that the mean is x = 48.
Going the other way: converting z back to an x This formula takes as input and produces as output. Multiply each side by . Add to each side. The result you get is: Now you have a formula that takes _____ as input and produces ___. Test it out: plug in , , , and compute. What do you get? ___=___. Is it the result you expected and hoped to see?