Download
1 / 22
220 likes | 294 Views
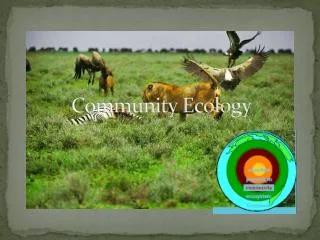
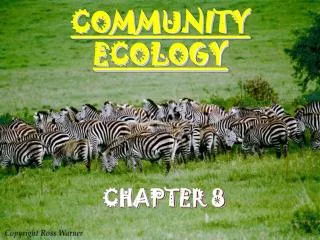
Community Ecology. Introduction. Introduced Predators Transform Subarctic Islands from Grassland to Tundra D. A. Croll,1 * J. L. Maron,2 J. A. Estes,1,3 E. M. Danner,1 G. V. Byrd4. + Foxes. - Foxes. Ecological Meltdown in Predator-Free Forest Fragments

E N D
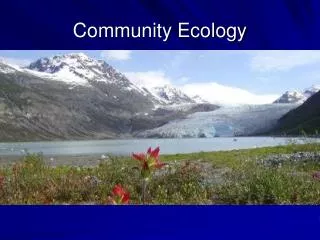
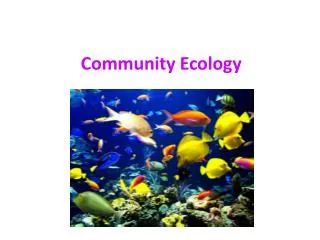
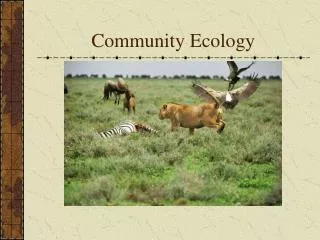
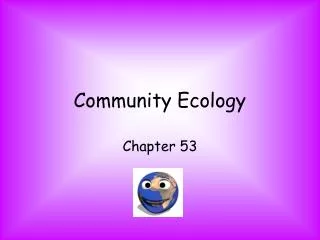
Community Ecology Introduction
Introduced Predators Transform Subarctic Islands from Grassland to Tundra D. A. Croll,1* J. L. Maron,2 J. A. Estes,1,3 E. M. Danner,1 G. V. Byrd4
+ Foxes - Foxes
Ecological Meltdown in Predator-Free Forest Fragments John Terborgh,1* Lawrence Lopez,2 Percy Nuñez,3 Madhu Rao,4, 5 Ghazala Shahabuddin,6 Gabriela Orihuela,7 Mailen Riveros,8 Rafael Ascanio,9 Greg H. Adler,11 Thomas D. Lambert,10 Luis Balbas12
Pattern Global patterns in biodiversity KEVIN J. GASTON a, Species–area relationship: earthworms in areas ranging from 100 m2 to >500,000 km2 across Europe76. b, Species–latitude relationship: birds in grid cells ( 611,000 km2) across the New World44. c, Relationship between local and regional richness: lacustrine fish in North America (orange circles, large lakes; blue circles, small lakes)61. d, Species–elevation relationship: bats in Manu National Park & Biosphere Reserve, Peru77. e, Species–precipitation relationship: woody plants in grid cells (20,000 km2) in southern Africa78.
Out of the Tropics: Evolutionary Dynamics of the Latitudinal Diversity Gradient David Jablonski,1* Kaustuv Roy,2 James W. Valentine3 ProcessHypotheses: Competing or complimentary?
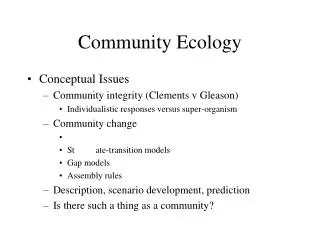
Local Diversity • Local processes build up to region? • Density/frequency dependence, niches • Regional processes filter to local? • Source pools, extinction speciation, neutral theory, niches
Biodiversity Hotspots Biodiversity hotspots for conservation priorities Norman Myers, Russell A. Mittermeier, Cristina G. Mittermeier, Gustavo A. B. da Fonseca and Jennifer Kent Nature 403, 853-858 (24 February 2000)
Fig. 1. Our case study area, GPNP and its surrounding 10-km buffer (black), is located on the southwest coast of the island of Borneo, in the province of West Kalimantan (light gray) L. M. Curran et al., Science 303, 1000 -1003 (2004)
Fig. 2. Cumulative forest loss within the GPNP boundary (yellow) and its surrounding 10-km buffer. Forest and nonforest classifications (13) are based on a Landsat Thematic Mapper time series). Classifications are shown for (A) 1988, (B) 1994, and (C) 2002. • Habitat loss • What do we expect to happen to communities? • What is a community? • What measures are we interested in? How do they change? • How do we go about getting at cause and effect in complex systems? L. M. Curran et al., Science 303, 1000 -1003 (2004)
Harvesting effects How do we get from great whale harvests (left) to kelp decline?
Harvesting: Fisheries management Fig. 1. Fraction of the sea bottom and adjacent waters contributing to the world fisheries from 1950 to 2000 (30) and projected to 2050 by depth (logarithmic scale). Note the strong reversal of trends required for 20% of the waters down to 100-m depth to be protected from fishing by 2020. The Future for Fisheries Daniel Pauly,1* Jackie Alder,1 Elena Bennett,2 Villy Christensen,1 Peter Tyedmers,3 Reg Watson1
48,000 Years of Climate and Forest Change in a Biodiversity Hot Spot Mark B. Bush,1* Miles R. Silman,2* Dunia H. Urrego
Continuous, high resolution (5mm/yr) core Continuous wet forest taxa for 50,000 yrs Gradual change in community composition Representation of pollen taxa
Two basic states 30 kyr 11 kyr Evidence of cycles Consuelo Ordination
Two major forest types Periodic changes ENSO, drought cycles, D-O events Gradual ~8-10 ky transition Non-equilibrium? DCA Axis 1 vs. Time