Download
1 / 21
210 likes | 220 Views
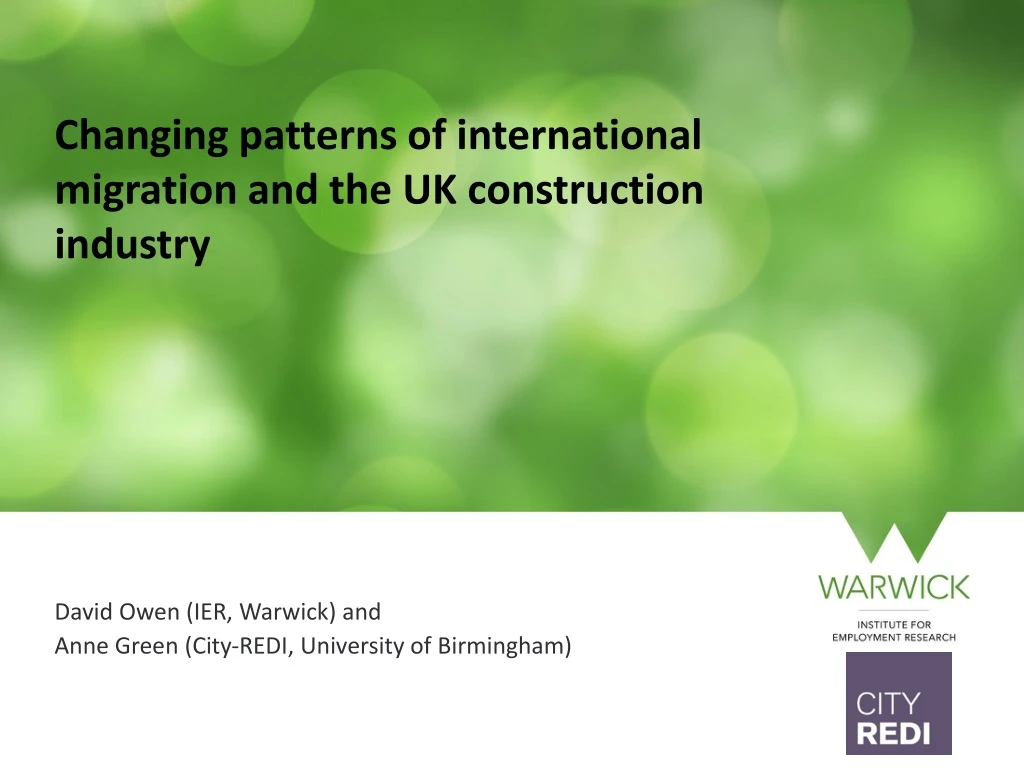
Changing patterns of international migration and the UK construction industry. David Owen (IER, Warwick) and Anne Green (City‐REDI , University of Birmingham). Introduction. . This paper presents the findings of research into the role of migrant workers in

E N D
Changing patterns of international migration and the UK construction industry David Owen (IER, Warwick) and Anne Green (City‐REDI, University of Birmingham)
Introduction This paper presents the findings of research into the role of migrant workers in the UK construction sector undertaken by IFF Research, City-REDI (Birmingham) and the Warwick IER for the CITB. It involved survey research with employers (by IFF), a literature review and analysis of data from the quarterly Labour Force Survey for the period 2007 to 2017. This project updated previous research undertaken in 2015. The project aimed to identify the changing size of the migrant workforce, why and how employers used migrant workers and how they are likely to respond to the changing availability of migrant workers after Brexit (the next slide explains the wider aims of the project if more detail). The quantitative research was concerned with the distribution of migrant workers across industries and occupations within the sector, their age breakdown and their changing geographical origins over time. The analysis therefore used both country of birth and nationality to identify migrant workers.
Focus on CONSTRUCTION: Aims & Objectives Agencies Non-UK workers Employers This research aims to explore: Role, volume and profile of migrant workers The profile of migrant workers Origins The nature, scale and demographics of the construction workforce The future plans of the migrant labour force Employers’ reasons for using migrant workers The role of employment agencies Current EU and non-EU immigration policy and responses Reasons for & benefits of using migrant workers Pay and conditions of migrant workers Demographics qualifications pay and conditions Occupations and employment status Potential impact of Brexit Benefits of migrant workers Reactions to Brexit Experiences /future plans Implications of Brexit
UK construction sector 2017 The quarterly Labour Force Survey (LFS) found just over 2.25 million people aged 16 to 64 working in the construction sector in 2017 in the UK. The largest industries within the sector are: “construction of residential and non-residential buildings” (employing a third of all workers); followed by “electrical installation” and “plumbing, heat & air-con installation”, (each employing nearly a tenth of workers). Over two-fifths were self-employed, and just over half were full-time employees. Just over a third were aged 35 to 49, with just under a quarter aged 25 to 34 and 29.3 per cent aged 50 to 64. The percentage of full-time employees declines with age (from nearly three-quarters of 16 to 24 year olds to under half of those aged 50 to 64), while the percentage self-employed increases with age.
Migrant workers in construction • The workforce is mainly British: 15% construction workers have non-UK origins and only 1 in 4 employers directly employ at least one non-UK worker • Cheaper pay rates for migrants are largely a myth: they are not a significant factor in why employers recruit non-UK workers • Employers do not have an explicit strategy of recruiting migrants: they select from the best applicants on offer and employ non-UK workers for their availability and to address skills shortages • Migrants’ skills levels are comparable to their UK counterparts: 59% of recruitment agencies say non-UK construction workers have similar skills levels to UK workers • Non-UK workers cover a range of occupations: including labourers, architects, skilled trades, construction directors/managers/supervisors, machine operatives, engineers, quantity surveyors and support roles
Employer dependence on non-UK workers Overall, how dependent would is your company is on non-UK workers? Not at all Not very Quite Very 16% 9% 69% 6% All All with direct non-UK 26% 23% 32% 19% employees Base: All employers (401); All employers with any direct non-UK workforce (180) Dependence on non-UK workers by region (very/quite) London Dependence on non-UK workers by size (very/quite) 50% South East 16% 17% 5-9 Yorkshire and the Humber 15% 10% 10-24 South West 12% West Midlands 15% 25-49 6% Wales 4% 23% 50-99 Scotland 3% Base: All employers (401) 23% 100+
Non-UK NINo registrations, 2002-2017 • Polish migration peaked in 2008, and has fallen in recent years Romania largest source of migrants since 2014 Southern European migration increased during recovery • • Surge of EU8 migrants after EU expansion. EU largest source of migrants after introduction of PBS. EU2 migrants outnumbered EU2 migrants from 2014. • • •
EU and non-EU long-term immigration for work-related reasons, UK, year ending June 2008 to year ending March 2018 • Number of EU migrant workers has recently declined, while the number of non-EU migrants has increased. There has been a sharper decline in EU workers seeking work since the referendum. •
Increase in migrant workers in construction, 2007-2017 • • There has been a steady increase in the share of migrants in the construction workforce since 2007. The length of time which migrant workers have been in the UK has increased, as has the share who have been in the UK over 5 years.
Broad national origins of migrant construction workers, 2007-17 The A8 countries were the largest source of migrant construction workers throughout the period 2007-2017. Migration from this source declined as the number from A2 countries increased after their transition period ended. The number of migrants from the EU15 and South Asia was similar, and increased during the recovery from recession. The number of migrants from other parts of the world stagnated or declined over this period. Source: Labour Force Survey
Largest 15 countries of origin among migrant construction workers, 2017 Country Country of birth Number 63,600 57,500 18,400 16,700 15,200 13,800 10,600 8,400 7,600 6,600 6,000 5,200 4,400 4,400 4,000 Nationality Number 60,700 56,500 16,700 15,400 13,800 8,500 8,300 5,000 4,200 3,700 3,600 3,500 3,400 3,300 2,700 Country The analysis classified migrants using both country of birth and nationality. • Migrants from the Commonwealth arrived earlier than EU migrants and were more likely to have UK citizenship. • Romania and Poland were the largest sources of migrant workers on both measures. The number of Romanians increased quickly 2015-17. • India and Ireland were the largest sources of migrants other than Eastern Europe. • These variables were used to classify workers into UK Born, Non-UK born with UK citizenship and Non-UK born with non-UK citizenship. % 2.8 2.6 0.8 0.7 0.7 0.6 0.5 0.4 0.3 0.3 0.3 0.2 0.2 0.2 0.2 % 2.7 2.5 0.7 0.7 0.6 0.4 0.4 0.2 0.2 0.2 0.2 0.2 0.2 0.1 0.1 Romania Poland India Lithuania Bulgaria Ireland South Africa Germany Portugal Pakistan Australia Iran Singapore Jamaica Kosovo Romania Poland Lithuania Ireland Bulgaria Portugal India Italy Albania France Iran Latvia Pakistan South Africa Greece • • Source: Labour Force Survey 2017 The number of these migrants by country of birth from Ireland and India was higher than those with the nationality of these countries, but for other EU migrants, country of birth and nationality totals are closer.
Industry and occupation • The industries with most migrants are test drilling, painting & glazing and construction of bridges & tunnels • The largest number of migrants are in skilled construction & building trades, skilled metal, electrical & electronic trades and corporate manager & directors
Migrant origin of skilled workers, 2017 The largest migrant shares were in “Construction and building trades n.e.c.” (22.9 per cent), “Painters and decorators” (22 per cent) and “Bricklayers and masons” (16.6 per cent). In contrast, the percentage of migrants is well below the average for skilled construction occupations for “Floorers and wall tilers”, “roofers, rooftilers and slaters”, “plasterers” and “Plumbers and heating and ventilating engineers”. SOC 2010 occupation code and title All workers Percentage of occupation UK-born UK citizen UK citizen born outside UK Non- citizen, born outside UK All Migrants 5311 Steel erectors 3,900 89.5 0.0 10.5 10.5 5312 Bricklayers and masons 62,300 83.4 2.3 14.3 16.6 5313 Roofers, roof tilers and slaters 54,000 95.0 0.4 4.6 5.0 140,300 89.6 3.8 6.6 10.4 5314 Plumbers and heating and ventilating engineers 5315 Carpenters and joiners 183,800 86.7 2.3 11.0 13.3 18,100 88.2 0.0 11.8 11.8 5316 Glaziers, window fabricators and fitters 201,500 77.1 3.5 19.4 22.9 5319 Construction and building trades n.e.c. 5321 Plasterers 50,100 91.3 0.8 7.9 8.7 5322 Floorers and wall tilers 26,700 95.0 1.7 3.3 5.0 5323 Painters and decorators 88,700 78.0 0.9 21.1 22.0 43,400 87.3 2.3 10.4 12.7 5330 Construction and building trades supervisors Skilled construction and building trades 872,700 84.9 2.4 12.7 15.1
Non-UK workers Qualifications : 68% of non-UK workers hold a construction-related qualification Age profile (LFS, 2015, 2017) Basic (Level 1) 7% Intermediate (Level 2) 31% Advanced 21% Graduate/Post- Graduate 29% Don't know 11%
Distribution of migrant workers in construction (LFS, 2017)
Non-UK workers’ future plans • • • • Nearly two-thirds were aware of EU workers’ rights to remain following Brexit. Of those not aware, 60% said they were more likely to stay in the UK as a result. Only just over a fifth definitely expect to leave the UK. There was a small increase in the percentage planning to leave since the research was previously undertaken in 2017.
Looking ahead (1) Working Futures projections indicate that employment in the construction sector will grow by 290 thousand (14.2%) between 2014 and 2024, but another 745 thousand workers will be needed to replace those retiring over this period. This, there will be a continuing need to recruit workers. A third of employers had been impacted by Brexit, up from a quarter in 2017 Employers are particularly concerned about retaining their existing non-UK workforce – less emphasis on training Agencies are more concerned about access to non-UK labour than employers, possibly due to their broader view of the labour market - two- fifths of agencies are expecting staff shortages Whilst almost four-fifths of employers expected no impact from potential restrictions on the number of migrant workers, this decreased to half of those who have any non-UK workers
Looking ahead (2) There could be labour ‘pinch points’, particularly in London and the South East: - London companies more likely to already be reporting impacts of Brexit: a lack of clients, project delays and staff shortages - half of London firms say they are dependent on non-UK labour Most current non-UK workers are not planning to leave: only 1 in 20 intends to work in construction abroad, while more than half expect to stay in the UK until they retire Older age profile of UK workers a cause for concern
For more information The research report produced for the CITB by IFF Research, City-REDI and the Warwick IER (published in July 2018) can be found at: https://www.citb.co.uk/research-and-insight/mobility-and- migration/migration-uk-construction-built-environment/ David Owen d.w.owen@warwick.ac.uk Anne Green A.E.Green.1@bham@ac.uk https://www.birmingham.ac.uk/schools/business/research/city-redi/index.aspx @CityREDI @Anne_E_Green www.warwick.ac.uk/ier