Download
1 / 26
260 likes | 333 Views
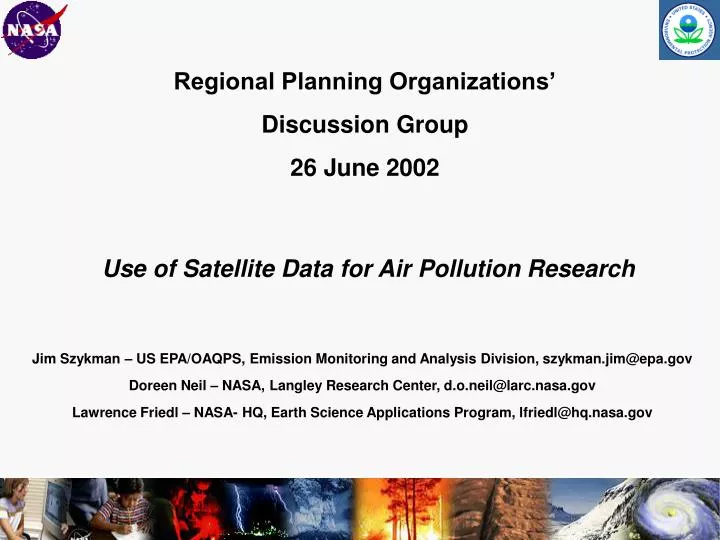
Regional Planning Organizations’ Discussion Group 26 June 2002. Use of Satellite Data for Air Pollution Research. Jim Szykman – US EPA/OAQPS, Emission Monitoring and Analysis Division, szykman.jim@epa.gov Doreen Neil – NASA, Langley Research Center, d.o.neil@larc.nasa.gov

E N D
Regional Planning Organizations’Discussion Group26 June 2002 Use of Satellite Data for Air Pollution Research Jim Szykman – US EPA/OAQPS, Emission Monitoring and Analysis Division, szykman.jim@epa.gov Doreen Neil – NASA, Langley Research Center, d.o.neil@larc.nasa.gov Lawrence Friedl – NASA- HQ, Earth Science Applications Program, lfriedl@hq.nasa.gov
Use of Satellite Data for Air Pollution Research • Overview of NASA Earth Science Enterprise (ESE) Applications Program • Overview of Satellite Remote Sensing Instruments • Current State of the Measurements • Potential Applications in Air Quality • Potential Future measurements
Earth Science in the Nation’s Service Extend the use of Earth science knowledge, data, and technology to support our partners’ decision systems and management responsibilities. Local Governments Federal Agencies Universities NASA Centers State Governments Scientists International Partners
NASA’s Earth Science Enterprise Earth Science Enterprise (ESE) Mission: Develop a scientific understanding of the Earth system and its response to natural and human-induced changes to enable improved prediction of climate, weather, and natural hazards for present and future generations ESE Applications Program: Expand and accelerate the realization of economic and societal benefits from Earth science, information, and technology.
Decision Support Cycle Decision Support Systems Data Sources/ Measurements - Public - Private - International Data Distribution/ Management Standards- based Products ESE Partners’ Prediction Models NASA ESE Contributions: Earth Observing System EOS Data Information System ESE/EOS Information Products
Decision Support: Serving Our Nation Applying NASA’s system engineering approach and ESE results to support decision-making tools, predictions, and analysis for policy and management decisions. Science Models GTEC, MOM3, GISS GCM, CCSM, HadCM3, ROMS, … Value & benefits to citizens and society Predictions Decision Support Systems HAZUS, AWIN, NREL, CMAQ, … Owned and operated by Partners Policy Decisions Management Decisions High Performance Computing, Communication, & Visualization Data Measurements SeaWinds, MOBY, Terra, MAMS, Aqua, AVIRIS, Aura,… Observations Inputs Outputs Outcomes Impacts
National Application Themes • Energy Forecasting • Carbon Management • Agricultural Competitiveness • Aviation Safety • Community Growth • Homeland Security • Public Health • Disaster Management/Preparedness • Coastal Management • Invasive Species Management • Water Management • Air Quality
National Applications: Approach Approach Validation & Verification Applications Benchmark Applications Research Applications Research • Extend scientific findings to requirements of operational environments • Identify designs for information and data products to (enable use by automated systems) Verification and Validation Reports • Benchmark approach and results of technology & operational technique • Identify improvements for information products Applications Benchmark • Document prototypes, guidelines, and procedures for potential operational implementation
Air Quality Management: Clean Air Standards and Air Quality Forecasts Earth System Modeling Framework Forecasts by 2012: Robust emissions control planning and management. Routine warnings of elevated pollution episodes. Accurate 3-day air quality forecasts. Primary Partners: CMAQ / Forecasts: State/regional planning. Same-day air quality predictions. DRAFT Prevent 15,000 premature deaths/year Mitigate $5B- $10B/yr crop damage Outcomes: Accurate (regional, multi-day)pollution forecasts.NAAQS planning andmitigation based on validated models. • Simultaneous, high time & space resolved multi-pollutant (O3, CO, NOx, SO2,HCHO, aerosol) data enablessound decision making Outcomes: Reassess ozone and precursor transport across state boundaries. Implement air quality strategies & related development policy based on detailed data and models. • Couple chemistry& aerosol models • Assimilate satellite data for trace constituents Impacts: Reduce asthma & lung related diseases. Improve visibility. Improve crop health & yields. Outcomes: Determine source and destination of long range dust and pollutants. Route airplanes. More accurate forecasts of haze & pollutionepisodes. Warn hospitals & farmers. • Monitor long range transport of mineral and pollution aerosol (CALIPSO) Outcomes: Quantify contributions of physical & chemical processes to pollutant concentrations. Extendozone forecasting to regional transport for urban to rural areas. Improved capabilities to air quality management tools to assess, plan and implement emissions control strategies & improve air quality forecasts. • Ozone, SO2 & NO2profiles & regional transport • (Build on TOMS & GOME) • Continental inflow/outflow Socioeconomic Impact Outcomes: Assess effects of emissions control options. Evaluate development options and emissions strategies to set policies and construct attainable State (air quality) Implementation Plans. Impacts: Reduce impaired lung function and use of medications. Reduce hospital admissions and lost work/school days. • Improveboundary conditions • (ozone residual) • Validate measurements Outcomes: Evaluate exceptionalevents for effect on NAAQS violations; provide exceptions for attainment. • Large scale • transport of • aerosols (TOMS aerosol index) Current trajectory: Steady improvement in documenting the chemical content of the lower atmosphere, Steady improvement in the physical accuracy of modeled processes for pollution episode warnings. NPOESS CALIPSO TERRA SAGE III TOMS AQUA AURA Cloud Sat 2000 2002 2004 2006 2008 2010 2012
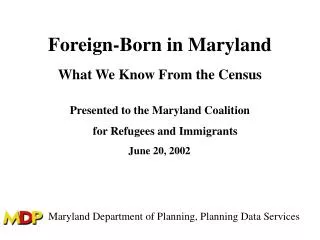
HIRDLS measurement stratosphere tropopause OMI measurement Difference = “tropospheric residual” troposphere Note: OMI horizontal resolution varies from 13 km x 24 km at nadir to about ~100 km at the extreme off-nadir. 24 km 13 km Source: Fishman, J., Chandra, S., Ziemke, J., Draft OMI-ATBD, Chapter 5: Tropospheric O3 Residual, May 2002 In general, tropospheric column density is determined using coincident measurements
Ozone Builds Off Coast Behind Stationary Front July 6: Major Northern Pollution Event Established Backward trajectory calculations show air from North contributing to ozone pool Meteorology Conducive to Widespread Stagnation July 9: Pollution Episode Develops In South Forward trajectories show eastward transport from ozone maximum off the coast of North Carolina into the South 3 days later Fishman and Balok [1999, JGR, 104, pp. 30,319] Satellite Data Captures Northern Pollution Invading Southern States
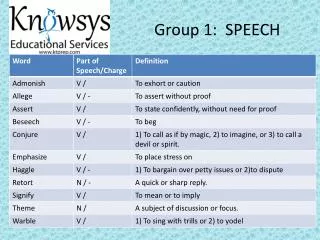
Earth Probe TOMS captures April 2001 China dust storm C o n c e n t r a t i o n , u g m / 3 1 6 0 1 5 0 D a i l y P M 1 0 a n d P M 2 . 5 C o n c e n t r a t i o n s f r o m 0 4 / 0 1 / 0 0 t o 0 4 / 3 0 / 0 0 S T _ N A M E = N C C T Y _ N A M E = F O R S Y T H S I T E = 3 7 0 6 7 0 0 2 2 P O C = 1 1 4 0 C o n c e n t r a t i o n , u g / m 3 April 7-9: Major dust storm originates over Gobi Desert 1 6 0 1 5 0 1 4 0 April 11-20: Remnants of dust storm move across the US 1 3 0 1 3 0 1 2 0 1 1 0 1 0 0 1 2 0 9 0 8 0 7 0 6 0 1 1 0 5 0 4 0 3 0 2 0 1 0 0 1 0 0 0 0 0 0 0 0 0 0 0 1 1 1 1 1 1 1 1 1 1 2 2 2 2 2 2 2 2 2 2 3 1 2 3 4 5 6 7 8 9 0 1 2 3 4 5 6 7 8 9 0 1 2 3 4 5 6 7 8 9 0 A A A A A A A A A A A A A A A A A A A A A A A A A A A A A A P P P P P P P P P P P P P P P P P P P P P P P P P P P P P P 9 0 R R R R R R R R R R R R R R R R R R R R R R R R R R R R R R 0 0 0 0 0 0 0 0 0 0 0 0 0 0 0 0 0 0 0 0 0 0 0 0 0 0 0 0 0 0 0 0 0 0 0 0 0 0 0 0 0 0 0 0 0 0 0 0 0 0 0 0 0 0 0 0 0 0 0 0 8 0 7 0 6 0 Analysis of TOMS AI with 700 mb heights indicates upper level transport of dust across the US 5 0 4 0 3 0 2 0 1 0 0 0 0 0 0 0 0 0 0 0 1 1 1 1 1 1 1 1 1 1 2 2 2 2 2 2 2 1 2 3 4 5 6 7 8 9 0 1 2 3 4 5 6 7 8 9 0 1 2 3 4 5 6 A A A A A A A A A A A A A A A A A A A A A A A A A P P P P P P P P P P P P P P P P P P P P P P P P P R R R R R R R R R R R R R R R R R R R R R R R R R 2000 0 0 0 0 0 0 0 0 0 0 0 0 0 0 0 0 0 0 0 0 0 0 0 0 0 1 1 1 1 1 1 1 1 1 1 1 1 1 1 1 1 1 1 1 1 1 1 1 1 1 Time series of PM10 and PM2.5 Forsyth County, NC April 2001 2 2 2 3 7 8 9 0 A A A A A P P P P P R R R R R 0 0 0 0 0 Backward trajectory indicates dust plume seen across Great Lakes on April 17 probable source of elevated PM10 in NC on April 20 1 1 1 1 1 Source: Mintz and Szykman, USEPA/OAQPS, 2002
Moskau Shihezi Bangkok Los Angeles Mexico City Singapur Kinshasa Jakarta Pretoria Rio de Janeiro Vertical NO2 Column Density [1014 molec/cm2] Leue et al. [2001, JGR, 106, pp. 5,501]
Initial SO2 Measurements from GOME capture Anthropogenic Emissions over Europe Source: A. Richter, University of Bremen
Regional Air Quality Modeling System (RAQMS) Chemical Assimilation/Prediction Public Impact Regional Prediction Global Assimilation ESE Satellite Products RAQMS can help validate and extend capabilities of air quality models
LITE Data represents future CALIPSO measurements of Clouds and Aerosol across the Eastern USA NASA LaRC LITE data, September 1994
CALIPSO, Aqua and CloudSat will fly in formation to obtain coincident observations of aerosols Source: CALIPSO http://www-essp3.larc.nasa.gov/picasso.html
O3 NO2 SO2 HCHO OMI “Tropospheric Residual” Data and Products potentially available in 2004
Use of satellite data within the Air Quality Community • EPA and NASA are working together on use of ESE data in Air Quality applications • Current data products have coarse temporal and/or spatial resolution, but are becoming a valuable tool in large scale air quality assessments • Near real-time data not routinely available, work underway for future near real-time products • Current scientific data archive established for researchers – need input from air quality community on useful data and products
Use of satellite data within the Air Quality Community • Satellite data cover vast areas, and remote, non-urban regions • Can provide boundary conditions for air quality models • Can help assess continental and regional transport • Can verify and improve emission inventories
Comparison of Pixel Sizes and Measurement Frequency for Different Satellites GeoTRACE (Hourly) TOMS (Daily) OMI (Daily) Map of Houston and surrounding area
GeoTRACEis a mission concept to investigate the effects of urban and regional emissions, weather, and chemistry on the global pollutants: carbon monoxide, ozone, and aerosols. From the unique perspective of geostationary orbit, GeoTRACE provides measurements that • are time resolved (hourly). • measure key tropospheric trace constituents(O3, CO, NO2, SO2, aerosol optical index, and others). • have excellent spatial resolution (5 km x 5 km). • occur simultaneously over continental or larger regions (domain is continental to full Earth disk).