Download

1 / 12
120 likes | 331 Views
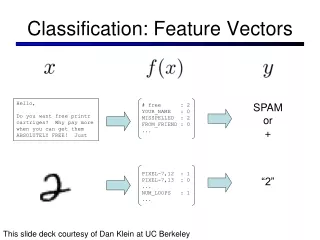
Feature extraction techniques to use in cereal classification. Ole Mathis Kruse, IMT. Problem. Is it possible to discriminate between different species- or varieties of cereal grains - using image analysis?. Barley. Oat. Wheat. Wheat - Mjølner. Wheat - Bjørke. The images.

E N D
Feature extraction techniques to use in cereal classification Department of Mathematical Sciences and Technology Ole Mathis Kruse, IMT
Problem • Is it possible to discriminate between different species- or varieties of cereal grains - using image analysis? Department of Mathematical Sciences and Technology Barley Oat Wheat Wheat - Mjølner Wheat - Bjørke
The images • Images are taken with a high resolution (1280 x 1024) digital camera. • Three images (rotated 120°) of each sample. • Each image splitted in four • Larger data material. • Easy to implement cross-validation. • 204 images for species analysis. • 84 images for variety analysis. Department of Mathematical Sciences and Technology
Texture analysis • How to discriminate the samples? • Single grain analysis • Measure size, roundness, colour etc. for each grain. • Extraction of singe grain is difficult. • Texture analysis • Finds features for the texture of the image surface. • Easy to implement. • Several different features available. Department of Mathematical Sciences and Technology
Feature detectors • Some examples of feature detectors • Angle Measure Technique (AMT)Images are folded out to an intensity vector.A circle is placed at random points on the vector, and the angle between the intersections arecalculated. Parameters are calculated from theseangles. • Histogram statisticsSeveral (~10) statistical parameters are calculated for each image. Some of these parameters are based on the intensity distribution of the images. Department of Mathematical Sciences and Technology From: Esbensen, Hjelmen & Kvaal (1996) Barley Oat
Feature detectors continued • Gray Level Co-occurence Matrix (GLCM)Builds a new matrix that countsthe number of differentneighbouring relations. Four statistical parameters arecalculated from the GLCM matrix. • Singular Value Decomposition (SVD) Department of Mathematical Sciences and Technology • Singular Value Decomposition (SVD)From Linear Algebra, a matrix M (e.g an image) can be factorized to the form M = USV*. U, S and V* are matrices which capture different characteristics of the image. We only use the S matrix, which has nonzero values only on the main diagonal. These nonzero values are the singular values of M and can be thought of as scalar “gain controls.” • There are lots of other methods, and also variants of the methods shown here.
Output from feature detectors • All methods give a matrix that ranges from 4 to 1000’s of columns with one row for each image • A complicated dataset with many variables • Difficult to analyse with univariate statistics (e.g. ANOVA) • Must use multivariate techniques Department of Mathematical Sciences and Technology
Multivariate statistics • Multivariate statistics analyses all variables at the same time and finds patterns that describe the variability • Covariance between variables is taken into account Automated identification of healthy and damaged tissue using imaging techniques • Several different multivariate statistical methods • Principal Component Analysis (PCA) • Partial Least Square Discriminant Analysis (PLSDA) Fra: http://en.wikipedia.org/wiki/Principal_component_analysis
Principal Component Analysis (PCA) • Typical result from PCA analysis Department of Mathematical Sciences and Technology
Partial Least Square Discriminant Analysis (PLSDA) • PLS is a multivariate regression technique • PLSDA allows discrimination/classification of the data Department of Mathematical Sciences and Technology
Classification results from different feature detectors • Compare the PLSDA classification with the known species/variety. • Calculate % correct classification for each species/variety for the different feature detectors. Department of Mathematical Sciences and Technology
Summary • Using 12 images of each sample gives better data quality. • Feature detectors are used to extract texture information from the images. • Multivariate statistics are used to analyse the feature data. • The cereal grain species are classified quite well. • SVD is the best detector. • Classification of wheat is strongly dependent on the varieties and the different feature detectors. Department of Mathematical Sciences and Technology