Download
1 / 91
940 likes | 1.2k Views
Feature Extraction. CSC 59866CD Fall 2004. Lecture 9 Image Segmentation. Zhigang Zhu, NAC 8/203A http://www-cs.engr.ccny.cuny.edu/~zhu/ Capstone2004/Capstone_Sequence2004.html. Finding Circles. If we don’t know r, accumulator array is 3-dimensional

E N D
Feature Extraction CSC 59866CD Fall 2004 Lecture 9 Image Segmentation Zhigang Zhu, NAC 8/203A http://www-cs.engr.ccny.cuny.edu/~zhu/ Capstone2004/Capstone_Sequence2004.html
Finding Circles • If we don’t know r, accumulator array is 3-dimensional • If edge directions are known, computational complexity if reduced • Suppose there is a known error limit on the edge direction (say +/- 10o) - how does this affect the search? • Hough can be extended in many ways….see, for example: • Ballard, D. H. Generalizing the Hough Transform to Detect Arbitrary Shapes, Pattern Recognition 13:111-122, 1981. • Illingworth, J. and J. Kittler, Survey of the Hough Transform, Computer Vision, Graphics, and Image Processing, 44(1):87-116, 1988
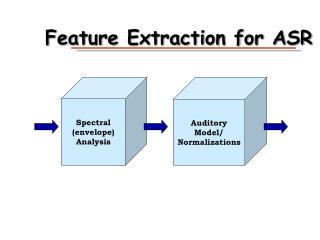
Region Segmentation • Partitioning of an image into different regions (connected components), each having uniform properties in some (set of) image feature(s): • gray value • color value(s) • textural qualities • local gradient • motion • shape info • ..... etc.
High Level Interpretations Objects Scene Elements Image Elements Raw Images Goal of Segmentation • Segment a scene into image elements which may correspond to meaningful scene elements
Primary Goal of Segmentation • “Segmenting an image into image elements which may correspond to meaningful scene elements” • What sort of image elements may correspond to meaningful scene elements? • Answer depends on type and complexity of images: • Less constrained scenes must be segmented more conservatively. • Segmentation is not a well defined problem.
Color Image Segmentation ? • Given a grayscale image, how do we generate a region segmentation? • In general, regions can be formed from the original image data or from 'derived' images: • - color images from R, G, B • - textural images • - displacement images from motion analyses • - 3D depth images
Problems with Segmentation In general, high level contextual knowledge is required for successful segmentation
Formal Definition of Regions • A region segmentation of an image, I, is a partition of the set of pixels of I into a set of K regions {Rj}, 1≤j≤K, such that: K Ç Rj 1. I =” Every pixel belongs to a region i=1 No pixel belongs to more than one region 2. Ri Ç Rj =Æ for i ≠ j 3. p connected to p’ for all p, p’ in Rj Spatial coherence Feature coherence 4. For some predicate P P(Ri) is TRUE for I = 1,2,…,K P(Ri Rj) is FALSE for Ri, Rj adjacent and i≠j Ç
Representing Regions • Region Occupancy Map • A set of region labels in registration with image I specifying the region association for each pixel Image Occupancy Map or Label Plane
Contour Representation Image
Chain Code • The chain code representation of a boundary is found by 'walking' counterclockwise around the boundary and recording the direction to turn to stay on the border: Direction Code
Chain Code CC = (i,j) {5 5 6 6 6 0 0 0 0 0 0 0 1 1 2 2 2 4 4 5 4 3 4 4}
Region Segmentation • Basic Approaches • Generalized thresholding • Region growing • Region merging • Region splitting • Split and Merge • Extensions to split and merge • K-means clustering • Watershed algorithms Grouping methods Partitioning methods
Partitioning Methods • Partitioning: • Given: a large data set. • Goal: carve it up according to some notion of the association between items inside the set. • We would like to decompose it into pieces that are “good” according to our model. • For example, we might: • decompose an image into regions which have coherent color and/or texture inside them; • take a video sequence and decompose it into shots — segments of video showing about the same stuff from about the same view point; • decompose a video sequence into motion blobs, consisting of regions thatwhave coherent color, texture and motion.
Grouping Methods • Grouping: • Given: a set of distinct data items • Goal: we wish to collect together sets of data items that “look similar” according to our model. • Effects like occlusion mean that image components that belong to the same object are often separated. • Examples of grouping include: • collecting together tokens that, taken together, form an interesting object • collecting together tokens that seem to be moving together. • Collecting together regions that have similar color and/or texture
Region Segmentation • Two Basic Techniques • Region Merging • START with many trivial regions (each pixel?) • MERGE regions into larger regions based on some similarity criteria • CONTINUE merging until no further merging is possible • Region Splitting • START with a single large region (entire image?) • SPLIT into several smaller regions based on a 'splitting' criterion • CONTINUE until no further splitting is possible (regions are 'uniform')
Region Segmentation • Basic Approaches • Generalized thresholding • Region growing • Region merging • Region splitting • Split and Merge • Extensions to split and merge • K-means clustering • Watershed algorithms
Generalized Thresholding • RLP(i,j) = k if Tk-1 <= I(i,h) < Tk k = 1,...,m • Tk are thresholds. • m is the number of distinct thresholds. • RLP (Region Label Plane) may contain significantly more than m 'regions', hence connected components must be found and the regions relabeled with distinct label numbers. • The thresholds Tk may depend on: • the entire image I(i,j), GLOBAL THRESHOLDS • N(i,j) (local neighborhood), LOCAL THRESHOLDS or • I(i,j) and N(i,j). DYNAMIC THRESHOLDS • To apply thresholding, must determine: • m - the number of thresholds, and, • Tk - the threshold values.
P1 P2 p(g) Gray level g Threshold T Threshold Selection • Manual: try one and see if it looks good • Histogram analysis • Strategies • Search for minimum between P1 and P2 • (search for minima between several peaks - multi-thresholding) • Fit second order equation • Differentiate to find minimum • Smooth image and/or histogram first • Histogram only points not on edges in histogram • Or unweight contribution of pixels having high gradient magnitude
Threshold Selection • Gaussian fitting • Intensity distribution for objects assumed to be normally distributed • Minimize false positives/false negatives • Match properties of binary and gray level image • e.g. moments • Choose threshold to maximize/minimize some function of the total edge gradient • Maximize property of image or histogram • e.g. entropy …………and probably lots of others
Optimal Thresholding • Approximate the histogram using a weighted sum of two or more probability densities with normal distribution • Threshold set at the closest gray level corresponding to the minimum probability between the maxima of two or more normal distributions. • Results in minimum error segmentation • Need to estimate parameters of the density functions • Implies optimization Probability distributions of backgrounds and object Corresponding histograms and optimal thresholds
Local or Adaptive Thresholding • Intensity values can vary as a function of lighting (for example)….e.g.: • Very difficult to threshold using conventional methods.
Local or Adaptive Thresholding • Each pixel in image needs a unique threshold • Two basic approaches • Chow and Kaneka Adaptive Thresholding (1972) • Compute thresholds in a local window at sampled locations using histogram technique • Interpolate local thresholds across image • Local Thresholding • Examine statistically pixel values in local neighborhood around pixel to be thresholding • Use local statistic as threshold • Possibilities include mean, median, or mean of max and min value Mean of 7x7 neighborhood
Mean 7x7 neighborhood; C=7 Mean 75x75 neighborhood; C=10 Median 7x7 neighborhood; C=4 Improved Results • Results can be improved if the threshold employed is not the mean, but (mean-C), where C is a constant. • Using this statistic, all pixels which exist in a uniform neighborhood (e.g. along the margins) are set to background.
Region Segmentation • Basic Approaches • Generalized thresholding • Region growing • Region merging • Region splitting • Split and Merge • Extensions to split and merge • K-means clustering • Watershed algorithms
Region Growing • Goal: Segment the image my repeatedly starting from a particular pixel, called a "seed" point, growing it into a region by iteratively adding neighboring points while some similarity criterion is met. • Is a set of algorithms to group pixels with similar attributes together • GENERAL IDEA • A pixel is added to a partially grown region if two conditions are satisfied: • The pixel must be adjacent to the region, and, • The pixel must be "similar enough" to pixels already in the region. • The process continues until no further points can be added. • Some other seed point, not already in any region, is chosen and the process is repeated until the entire image is segmented.
Region Growing • Use a region label plane RLP • same size as the original image • contains a 1 if the corresponding image point is in the region, 0 otherwise • initially contains a 1 corresponding to the seed point Region Label Plane Image
Similarity Criteria • When is a pixel "similar enough" to be added to the region? • different choices: • statistical population tests • simple feature differences • General Idea • Apply iteratively to all pixels until no more pixels are added. IF RLP(i,j) = 0 AND RLP(i-n, j-m) = 1 for some n,m = -1 to 1 AND |I(i-n, j-m) - I(i,j)| < T (a predefined threshold) THEN RMP(i,j) = 1
Example: Simple Region Growing Seed Point T=16 T=32 T=64 T=128
Problems • What’s the similarity criterion? • How do I select the threshold? • Why does the algorithm ‘leak’? • Because of leaks, features in a region can vary arbitrarily. • Fixed thresholds do not take into account characteristics of global spatial distribution. pixel sequence: p1,..., pk pj, pj+1neighbors | pj - pj+1| < T but | p1 - pk| > T pk p1
Region Segmentation • Basic Approaches • Generalized thresholding • Region growing • Region merging • Region splitting • Split and Merge • Extensions to split and merge • K-means clustering • Watershed algorithms
Region Merging • Define a distance function between regions. • general form: dij = D(Ri, Rj) > 0 • Typically D is a distance measure in feature space and is a function only of the feature vectors associated with regions Ri and Rj: dij = D(fi, fj) > 0 • Merge regions with minimum distance • Need to define some kind of termination criteria
Ni Nj 2 2 + |ri - rnew| |rj - rnew| rij = Nnew Nnew Example Distance Measures • Distance between color means • Distance between region centers • Weighted combination of the two • Where Nm is the number of pixels in Rm Ni Nj 2 2 |mi - mnew| |mj - mnew| + cij = Nnew Nnew dij = a cij + b rij
Region Merging • Define a distance measure dij = D(f(Ri), f(Rj)) >0 • Algorithm: { While termination condition false Determine the minimum distance regions {i*, j*} = arg min dij Merge the minimum distance regions Ri*¬ Ri* U Rj* Remove merged region from region list L ¬L-{Rj* Compute termination condition } Ri, RjÎ L i,j
Merging Hierarchy • Algorithm generates a binary tree • Merging can be terminated when the minimum distance exceeds a threshold d i*,j* > T stop merging • Different thresholds produce different segmentations
Fisher’s Criterion • Mean and variance are good features to use for merging • Especially if data is distributed normally • e.g. is modeled by the Gaussian distribution • Peak occurs at m (the mean) and has a value a • a is (1 / 2ps2) and ensures that the area under the curve = 1 • For modeling histograms • Compute area under the histogram and divide by (2pn) • Parameter n is called the variance • s = sqrt (n) is the standard deviation • n measures the ‘flatness’ of the distribution 1/2 1/2
m1 - m2 > l 2 2 n1 - n2 Fisher’s Criterion • Discrimination between regions of different means and standard deviations can be done using Fischer’s criterion: • l is a threshold • If two regions have good separation in the means and low variance, then we can separate them.
Uniformity • Thus, the merging threshold for the mean intensity for two adjacent regions, l, should vary depending on the expected uniformity of the merged region • Less uniform regions will require a lower threshold to prevent under merging Uniformity a function of both intensity mean and variance of the region • Combine them (heuristic) as • Uniformity = 1 - n / m • In range 0-1 for case where the samples are all positive • The threshold value l decreases with the decrease in uniformity as • l = (1 - n / m ) l0 • User need supply only one threshold l0 2 2
Region Segmentation • Basic Approaches • Generalized thresholding • Region growing • Region merging • Region splitting • Split and Merge • Extensions to split and merge • K-means clustering • Watershed algorithms
Region Splitting • Region Splitting: (1) Start with a single large region (initially, entire image). (2) Recursively split it into smaller regions. (3) Continue splitting until each region is uniform (no further splits are possible). • A simple approach: Global Thresholding • Define a global threshold T • Apply to every pixel in the image I: RLP(i,j) = 0 if I(i,j) < T RLP(i,j) = 1 if I(i,j) ≥ T
Region splitting: Multiple Features • Old algorithm: Ohlander-Price • Basically a sequential histogram-based multiple threshold algorithm. • Features used RGB, HSI, and YIQ (9 images) • General Idea: • Start with the entire image as the initial region. • Get the next region to be segmented • if none - the segmentation is complete. • Compute the set of one-dimensional histograms. • Select the "best" peak and find valleys on either side • if none, the region is "done" - put on finished list. • Apply the threshold to the region and determine connected components. • Add these regions to the list of regions to be further segmented and go to step 1.
Peak Selection Criteria 0 Intensity peak in 0-60 or 200-255 ranges Best is closest to end 1 Both minima < 10% highest value max/min ratio > 4 Another peak exists with max/min ratio > 2 2 Both minima < 25% of the peak value max/min ratio > 2 Another peak with max/min ratio > 2 3 Max/min ratio > 2 Another peak with max/min ratio > 2 If maxima are within 10%, then both are acceptable (a bimodal distribution) 4 (Saturation only) Minima in 0-200 (lowest 20%)< 25% of the peak value max/min ratio > 2 Specified minima must separate peak with max/min ratio > 1.2 5 Minima < 10% of highest value 10% of all points must be outside the peak 6 Minima < 70% of highest value max/min ratio > 1.7
Region Segmentation • Basic Approaches • Generalized thresholding • Region growing • Region merging • Region splitting • Split and Merge • Extensions to split and merge • K-means clustering • Watershed algorithms
Hybrid Technique • Split and Merge • combination: splits followed by merges (or vice-versa) • split and merge decisions can be either • local: a pixel and its immediate neighbors a region and its immediate neighbors • global: on the basis of a large number of pixels scattered throughout the image