Download
1 / 18
200 likes | 280 Views
Instrumental Methods: Intro. q Types of Instrumental Methods q Fundamental Components of an Instrument q Instruments Measure Voltages and Currents! q Basics of Analytical Methods Review Terminology

E N D
Instrumental Methods: Intro qTypes of Instrumental Methods qFundamental Components of an Instrument qInstruments Measure Voltages and Currents! qBasics of Analytical Methods Review Terminology Some notes and figures in this course have been taken from Skoog, Holler and Neiman, Principles of Instrumental Analysis, 5th Edition, Saunders College Publishing.
Basic Instrument Components • Source: produces some form of energy or mass that is relevant to the measurement at hand • Sample Holder or “Cell”: contains the sample with your analyte of interest • Discriminator: selects the desired signal from the source or the sample • Input Transducer: detects the signal from the sample, source or discriminator. AKA the detector. • Processor: manipulates the signal electronically or mechanically to produce some useful value • Readout: displays the signal in some useful form.
Instruments Measure 1 of 2 Things. • VOLTAGE (V), volts, electrical potential across two electrodes. • Current (A), amperes, the flow of electrons across some point. • V = IR • R= resistance in Ohms • THEY DO NOT MEASURE ABSORBANCE, FREQUENCY, MASS, CONCENTRATION OR ANY OTHER CONVENIENT UNIT. THEY MEASURE CURRENTS OR VOLTAGES, WHICH ARE THEN CONVERTED TO THESE CONVENIENCE UNITS!
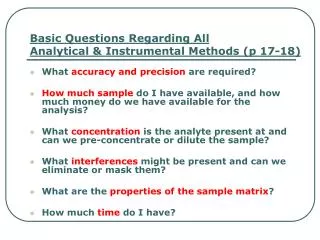
Basic Questions Regarding All • Analytical & Instrumental Methods • Defining the “instrumental analysis” Problem: • oWhat accuracy and precision are required? • oHow much sample do I have available, and how much money do we have available for the analysis? • oWhat concentration is the analyte present at and can we pre-concentrate or dilute the sample? • oWhat interferences might be present and can we eliminate or mask them? • oWhat are the properties of the sample matrix? • How much time do I have (time = money)?
Some Basic Definitions (Review) • A sample is collected or taken • An aliquot is usually selected from the larger, bulk sample for preservation, preparation and/or analysis • A technique implies the use of a specific type of instrument for analysis • A method is the procedure followed when utilizing an instrumental technique • A protocol is a regulatory or “officially” recognized method that must be adhered to • GLP stands for Good Laboratory Practice • GMP stands for Good Manufacturing Practice
Relevant Analytical Parameters • These are new. You should be familiar with accuracy, precision, average, standard deviation, %relative standard deviation, etc. • Analytical Sensitivity: The slope of the calibration curve (IUPAC Definition) • Thus, other factors being equal, the method with the steepest calibration curve will be more “sensitive” • Better ability to discriminate between numerically close concentrations.
Detection Limit (DL, LOD, MDL) • Most widely disputed term in instrumental methods. • The minimum concentration of analyte that can be detected, based on the analytical signal. • DETECTED, not necessarily known with any great confidence! LOD = [Mean Blank Signal] + 3 x Std. Dev. Blank Signal • In general, 3 is chosen as the multiplier because at + 3 STDEV, you are 99% confident you are not measuring signal from noise, background, etc. • Measurements at or near the limit of detection are not necessarily precise (high %RSD)! This is what instrument manufacturers will quote you, as measured under the most ideal, not regularly attainable, conditions! • The STDEVBlanksignal is often replaced with the standard deviation for some very, very low (near the DL) sample you have prepared. • This signal is then used with the cal. curve to calculate a DL.
Calculate the limit of detection for the determination of yttrium by the PINK METHOD if the measurement of the blank 50 times yielded a mean signal of 1.00 and a standard deviation of 0.20 absorbance units.
Limit of Quantitation (LOQ) • Another somewhat disputed term. • The LOQ is generally considered the minimum concentration of analyte that can be “accurately” and “precisely” determined. Exact definitions vary, however.. • You measure a blank AND a VERY low concentration sample that is near the detection limit) numerous times, and then use that data. • 10 times is the typical number of replicates • This signal is used in the calibration curve to calculate the MDL.
Dynamic Range • Usually called the Linear Dynamic Range, this is the concentration range over which the calibration curve has a linear shape. • You have probably seen an instrument exceed its linear dynamic range with the SPEC 20 • Beer’s Law fails at increasing concentrations due to instrumental and sample solution factors. • Sample matrix, analyte and method dependent. • You usually want to work with linear calibration curves if at all possible (much less complex than quadratic, exponential or polynomial fits) • Determination of Metals by AAS : 1-3 orders of magnitude • Determination of Metals by ICP-AES: 5-8 orders of magnitude
Selectivity • Also known as discrimination • The ability to discern different, yet closely spaced analytical signals. • The spectrometer on the SPEC 20 can discriminate wavelengths of light that are about 20 nm apart (even if you can set wavelengths only 5 nm different) • The spectrometer on our Varian ICP can discriminate wavelengths of light that are 0.005 nm apart! • Better selectivity means you can be sure which signal is which when you have more than one analyte in the sample! • However, if all other conditions are equal, increasing selectivity will decrease the amount of signal you can measure (reduce the LOD)!
Bandwidth is closely related to selectivity in optical spectrometers. It is a measure of what range of light we allow to strike the detector at any given time.
EVERYTHING YOU DO IN THIS CLASS WILL BE A BATTLE!THE BATTLE BETWEEN SIGNAL AND SELECTIVITY!There is no way to maximize both. You have to choose some happy medium, where you get enough signal to detect the analyte, but can also be selective enough so that you are sure of what you are detecting.