Download
1 / 20
200 likes | 201 Views
RD50 Workshop, CERN, 1 3 -1 5 .11.201 3. Update on the temperature dependence of the bulk current in Si. A.Chilingarov Lancaster University. Layout Cooling with double Peltier layer Updated results on E eff measured in Lancaster Discussion Conclusions.

E N D
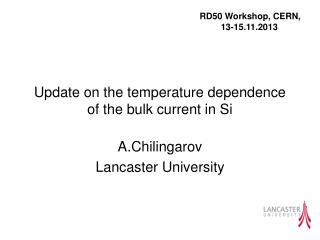
RD50 Workshop, CERN, 13-15.11.2013 Update on the temperature dependence of the bulk current in Si A.Chilingarov Lancaster University
Layout • Cooling with double Peltier layer • Updated results on Eeff measured in Lancaster • Discussion • Conclusions A.Chilingarov, I(T) update, 14.11.2013
The talk is based on two recently published papers: • A.Chilingarov, “Operation of two stacked Peltier elements”, 2013 JINST 8 T10001, • http://dx.doi.org/10.1088/1748-0221/8/10/T10001 • 2. A.Chilingarov, “Temperature dependence of the current generated in Si bulk”, 2013 JINST 8 P10003, • http://dx.doi.org/10.1088/1748-0221/8/10/P10003 • Please use these references for more details. 3 A.Chilingarov, I(T) update, 14.11.2013
1. Cooling with double Peltier layer A new set-up with cooling by two stacked identical Peltier elements was built allowing lower temperatures in I(T) measurements. On the next slides the layer in the contact with the heat sink is called bottom layer and another – the top one. A.Chilingarov, I(T) update, 14.11.2013
Surprisingly the cooling efficiency of the layers was very different. With only one layer biased the temperature difference between the DUT box and the heat sink was much lower for the active top layer. The reason for this is its thermal shielding from the heat sink by the thermal resistance of the bottom layer. A.Chilingarov, I(T) update, 14.11.2013
The optimal cooling with both layers active required keeping Utop at 4V (near the maximum of its cooling curve) and varying the Ubottom. The resulting temperature difference is only by about 20% higher than what could be achieved with a single layer. 6 A.Chilingarov, I(T) update, 14.11.2013
2. Updated results on Eeff measured in Lancaster The lowest temperature achievable in the new set-up was -52oC. The p-type sensors irradiated by the 1 MeV neutron equivalent fluence of 1013, 1014 and 1015 per cm2 were re-measured in a wider temperature range. Sensible measurements with the sensor irradiated by 1016 neq/cm2 became possible. In addition the sensor irradiated by 1014 neq/cm2 was annealed by keeping it at the temperature of +65oC for 8.5 hours. The Eeff for the annealed sensor was also measured. The measurement and analysis procedures are illustrated in this talk only by the data for one sensor. See the paper mentioned on slide 3 for the full set of data. 7 A.Chilingarov, I(T) update, 14.11.2013
Sensor x2y4 irradiated by 1013 n/cm2 Ic-V curves Below depletion the current grows as a square root of Ubias as expected for the current generated in the bulk. U0.5 Kink position A.Chilingarov, I(T) update, 14.11.2013
To equalise the weight of the points with the values of the current differing by 3 orders of magnitude the errors of 1% were assigned to the points and used in the fit. Typical c2/Ndf was ~1, i.e. typical spread of the points around the fit curve was ~1% Bias points from 2 to 500V were combined in 20 groups and the average current for each group was fit by T2 exp(-Eeff/2kT) as a function of temperature. The fits for 4 bias groups are shown as examples. A.Chilingarov, I(T) update, 14.11.2013
There are no signs of the sensor self-heating. Maximum power dissipation Itotal*Ubias=3 mW. It was used as a limit in measurements with all other sensors to suppress the self-heating effects. The Eeff values as a function of bias for 3 temperature ranges. Average value and the standard deviation are calculated using the filled points. The error includes the Eeff variations with bias and the temperature range. A.Chilingarov, I(T) update, 14.11.2013
Eeff for all investigated sensors vs. fluence. The green point is for the annealed sensor and the red for the most heavily irradiated one. The average and the standard deviation is calculated for the black points only. A.Chilingarov, I(T) update, 14.11.2013
3. Discussion Apart from that for the sensor irradiated by 1016 neq/cm2 all measured Eeff values agree between themselves. Their average value agrees with 1.21 eV expected for the generation via a mid-gap level. The intense annealing didn’t change the Eeff value. Below depletion voltage the active volume is not fixed by the sensor geometry. Therefore an additional variation of the current with temperature can appear due to possible dependence of the effective depleted volume on temperature, which may distort the Eeff value. This effect is probably responsible for the abnormally low Eeffobserved for the most heavily irradiated sensor. A.Chilingarov, I(T) update, 14.11.2013
The current at -52oC normalised to the measured (for two low fluences) or projected value at the “kink” position. For 1013 and 1014 neq/cm2 the “kink” voltages are 30V and 435V respectively. For the high fluences the projected “kink” voltages are surprisingly low: 1020V for 1015/cm2 and 1600V for 1016/cm2. For high fluences the current reaches the value corresponding to the sensor full depletion at the voltages much lower than anticipated values. At -52oC all points in the plot satisfy the requirement of Itotal*Ubias < 3 mW, which excludes the self-heating effects. A.Chilingarov, I(T) update, 14.11.2013
The slopes calculated for the curves from the previous slide for the high fluences. They indicate the current growing much faster than U0.5 expected for the uniform space charge density in the depleted area. The results on this and previous slide can be explained by the contribution to the current from the carriers generated in the electrically neutral bulk (ENB) and pulled out to the space charge region by the electric field existing in the ENB. The effect becomes more pronounced with irradiation. 14 A.Chilingarov, I(T) update, 14.11.2013
The full depletion voltage expected for the sensor irradiated by 1016 neq/cm2 is very much higher than the bias voltage used in the measurements. From the previous two slides it is clear that the current in this sensor has a large contribution from the carriers generated in the ENB. Therefore a subtle temperature dependence of the fraction of these carriers pulled out to the depleted volume can affect noticeably the I(T) dependence and consequently the Eeff. Such explanation looks more plausible than the assumption of the carrier generating mechanism changing above the 1015 neq/cm2 fluence. Measurements with thinner detectors allowing their nearly complete depletion even after 1016 neq/cm2 are necessary to clarify the situation. Meanwhile one can only notice that the Eeff values measured for this sensor grow steadily with bias above 400 V as demonstrated on the next slide. 15 A.Chilingarov, I(T) update, 14.11.2013
The Eeff vs bias for the sensor irradiated by 1016 neq/cm2. Different sets of data correspond to different temperature ranges with minimum temperature of -52oC and the maximum one indicated in the legend. Only the points with power dissipation <3 mW are presented. There is no clear bias dependence and all points were used to calculate the average and standard deviation. Note however that above 400V all curves show Eeff growing with bias. 16 A.Chilingarov, I(T) update, 14.11.2013
4. Conclusions • Lancaster measurements give Eeff=1.214±0.014 eV. This result is valid for both p-type and n-type sensors and for the fluence up to 1015 neq/cm2. It agrees well with the value of 1.21 eV expected for the generation via a mid-gap level. • The annealing of one of the sensors at 65oC for 8.5 hours didn’t change the Eeff value. 3. Relatively low value Eeff = 1.160±0.006 eV observed for the sensor irradiated by 1016 neq/cm2 is probably due to the sensor operation at bias much lower than that of full depletion. 4. An analysis of Eeff dependence on bias is crucial for selecting the data representing the bulk current. Absence of such analysis in the literature data may be responsible for a relatively wide spread of the Eeff values observed there. A.Chilingarov, I(T) update, 14.11.2013
Acknowledgements The author is grateful to Graham Beck from Queen Mary University of London for numerous stimulating discussions. A.Chilingarov, I(T) update, 14.11.2013
Back-up slides A.Chilingarov, I(T) update, 14.11.2013
Eeff vs bias for the sensor irradiated by 1015 neq/cm2 in 4 temperature ranges with Tmin=-52oC and Tmax indicated in the legend. Only the points with power dissipation <3mW are shown. The average and the standard deviation were calculated for the points shown by the filled symbols. 3 A.Chilingarov, I(T) update, 14.11.2013