Download
1 / 25
350 likes | 1.3k Views
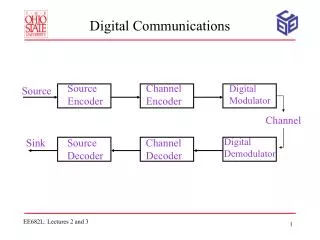
Digital Communications Basics Dan M. Goebel 4/23/2002. Digital Communications System Block Diagram. From: B.Sklar Digital Communications , Prentice Hall, NJ 2001. Digital “Bandpass” Modulation. PSK. FSK. ASK. APK/QAM.

E N D
Digital Communications Basics Dan M. Goebel 4/23/2002
Digital Communications System Block Diagram From: B.Sklar Digital Communications, Prentice Hall, NJ 2001
Digital “Bandpass” Modulation PSK FSK ASK APK/QAM Figure of Merit = Eb/No = Energy per bit divided by noise power density (digital systems equivalent for Signal to Noise Ratio (SNR)) From: B.Sklar Digital Communications, Prentice Hall, NJ 2001
Digital Data Rate • The data rate (bits per second) is given by the energy per bit (Eb = the energy in the digital pulse) times the rate at which bits are sent (“bit rate” for binary pulses, or “symbol rate” if each bit represents a word) Average Signal Power Level = Eb * R • The data rate is increased by increasing the rate at which bits or symbols are sent, which effectively increases the duty of the signal • At a given Eb, increasing the rate increases the required signal power Higher digital data rates require higher signal power
Maximum Digital Data Rate • Maximum channel capacity is given by Shannon’s Law: C (bps) = B log2 (1 + SNR) = B log2 (1 + ) where B = bandwidth, R = symbol rate • Maximum bit rate = n (bits/sec/Hz) = log2M (M is the number of constellation points) • Maximum data rate is the bit rate times the bandwidth = n*B Eb B No R Mn Type (f) Type (QAM) 2 1 BPSK ----- 4 2 QPSK 4QAM 8 3 8PSK 8QAM 16 4 16PSK 16QAM 32 5 ---- 32QAM Example: B=2 MHz, SNR=20 dB C = 13.3 Mbs (Shannon) Data rate = 4 Mbs if use QPSK = 10 Mbs if use 32QAM (must increase B to get higher rates)
Digital Signal Detection “constellation plots” Must be able to distinguish each point, which leads to “bit errors”
The Useful Digital Data Rate Determined by Error Probability Bit Error Rate (BER) • For high data rates • and low bit error rates: • High bandwidth • High SNR (Eb/No) • High-order modulation schemes 64QAM 32QAM 16QAM BPSK/QPSK 8PSK From: B.Sklar Digital Communications, Prentice Hall, NJ 2001
Constellation Plot Example Bit errors in red Eb/N0 = 11 dB Eb/N0 = 6 dB Eb/N0 = 2 dB Low signal to noise ratio leads to discrimination errors
Cause of Performance Degradation in Digital Communications Systems • Signal loss (Eb term) • due to absorption, scattering, reflection, refraction, pointing, etc. • Inter-Symbol Interference (N0 term) • due primarily to frequency dependent effects (in channel or amps) • Noise and interference (N0 term) • intermodulation distortion • interfering signals (co-channel and adjacent channel interference) • amplifier noise sources (shot, flicker, thermal) • atmospheric and galactic sources
Error Probability versus Phase Jitter QAM constellation with AWGN and phase jitter Average power constrained Peak power constrained Note: amplifier AM/PM produces phase noise from amplitude changes in channel
Reducing Impairments for Bit Error Rate Saturated QPSK amplifier produces large impairments Amplifier linearity reduces impairments, so backoff improves the bit-error rate
Trends in Digital Communications • QPSK Systems were “standard” • constant amplitude: amps. run near saturation for high efficiency • common in satellite communications (DirecTV and Satellite Radio) • Want higher data rates (High Definition TV, Internet, etc.) • utilize 8PSK (compatible with QPSK hardware, 2x data rate) • utilize QAM or other higher order modulation schemes • amplifiers run with varying amplitude and phase • May need spread spectrum (CDMA, OFDM) • mobile system fade/reflection tolerant • effectively thousands of channels (frequencies) in band • high peak to average ratio is very hard on amplifiers (clipping)
High Peak-to-Average Operation CCDF for OFDM >1% of the time the amplifier is saturated CDMA is similar, requiring >9 dB OBO to avoid clipping amplifier saturation
Telecommunications Example • Intermodulation Distortion is critical • adjacent channel power level is strongly regulated adjacent channel power
Reducing Intermodulation Distortion Run “backed off” from saturation Backoff reduces the adjacent channel power level
Amplifier Design For Digital Comm. • Low intermodulation distortion (IMD) requires large backoff • Need good third order interception point for low IMD • Options: • Design for efficiency and accept large back off • Design for minimum AM/PM • Design for C/3IM (gain, power and phase together) * Output Backoff Third-order Intercept Point *D.M. Goebel, R.Liou, W. Menninger, “Development of linear TWT amplifiers for Telecommunications Applications”, IEEE Transactions on Electron Devices, 48, 74-81 (2001).
3rd Order Interception Point Conventional figure of merit for linearity Higher 3OI gives lower IMD at a given operating point
TWT Amplifier Designed for Linearity Conventional design produced ≈40˚ phase shift at saturation TWT designed to minimize AM/PM to reduce phase shift to <10˚ at sat. Resulted in slight gain expansion and non-uniform AM/AM curve
Improve Amplifier Performance Predistorter-linearizer • Utilize predistorter to improve transfer curve characteristics and overall linearity • Many types available • Passive • Active • Harmonic • Digital
Passive Predistorter-linearizer Amplitude (2 dB/division) ≈9 dB expansion Optimized to match TWT design #3 with low phase change Phase (2 deg/division) ≈7 degrees correction
Predistorted Amplifier Performance Phase (degrees) Gain or Power C/3IM (dBc) Strongest improvement near saturation (5 to 7 dB) Input Power (dBm) Outut Power (dBm) Transfer Curves C/3IM versus output power
Predistorted Amplifier Optimization • Need to match TWT characteristics to predistorter characteristics • For a passive predistorter with parabolic diode-type transfer curves, the “optimized” TWT (design #4) produced only 5-to-7 dB improvement in the 2-tone C/3IM • Could not match “diode-like” predistorter characteristics to the TWT’s shallow AM/PM transfer curve and inflecting AM/AM curve • The more conventional TWT design of design #5 produced over 15 dB improvement in 2-tone C/3IM with the predistorter • Conventional “parabolic” transfer curves matched well
Telecommunications Feed-forwardLinearizer Multi-Channel Power Amplifier (with feed-forward circuit) Total TWT only ------ 28 dB 30 dB 65 dBc TWT#4 5 dB 35 dB 30 dB 70 dBc TWT#5 >15 dB 30 dB 30 dB >75 dBc *FCC requires ≥70 dBc
Conclusions • Digital Communication is headed for higher data rates • Higher bandwidth and higher order modulation schemes • Requires higher power levels and/or lower noise amplifiers • Digital Communications systems are sensitive to impairments • Energy per bit (power level) important for low error rates (BER) • Linearity important for detection accuracy = BER • Intermodulation distortion for inter-symbol interference and adjacent channel power • Communications amplifiers must be designed for these points • Trade off between backoff level and linearity to reduce impairments • Predistorter/linearizer helps, but it must be optimized with the amp