Download
1 / 16
160 likes | 292 Views
Objectives. Graph linear inequalities on the coordinate plane. Solve problems using linear inequalities.

E N D
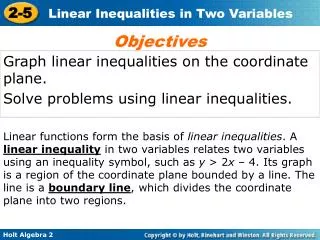
Objectives Graph linear inequalities on the coordinate plane. Solve problems using linear inequalities. Linear functions form the basis of linear inequalities. A linear inequality in two variables relates two variables using an inequality symbol, such as y > 2x – 4. Its graph is a region of the coordinate plane bounded by a line. The line is a boundary line, which divides the coordinate plane into two regions.
For example, the line y = 2x – 4, shown at right, divides the coordinate plane into two parts: one where y > 2x –4 and one where y < 2x –4. In the coordinate plane higher points have larger y values, so the region where y > 2x – 4 is above the boundary line where y = 2x – 4.
Helpful Hint Think of the underlines in the symbols ≤ and ≥ as representing solid lines on the graph. To graph y ≥ 2x – 4, make the boundary line solid, and shade the region above the line. To graph y > 2x – 4, make the boundary line dashed because y-values equal to 2x – 4 are not included.
The boundary line is which has a y-intercept of 2 and a slope of . Then shade the region above the boundary line to show . Graph the inequality . Draw the boundary line dashed because it is not part of the solution.
? ? 2 > 1 Example 1A Continued Check Choose a point in the solution region, such as (3, 2) and test it in the inequality. The test point satisfies the inequality, so the solution region appears to be correct.
Graph the inequality y≤ –1. Recall that y= –1 is a horizontal line. Check The point (0, –2) is a solution because –2 ≤ –1. Note that any point on or below y = –1 is a solution, regardless of the value of x. .
Graph the inequality y ≥ 3x –2. The boundary line is y = 3x – 2 which has a y–intercept of –2 and a slope of 3. Draw a solid line because it is part of the solution. Then shade the region above the boundary line to show y > 3x – 2. Check Choose a point in the solution region, such as (0, 0) and test it in the inequality.
Helpful Hint The point (0, 0) is the easiest point to test if it is not on the boundary line. If the equation of the boundary line is not in slope-intercept form, you can choose a test point that is not on the line to determine which region to shade. If the point satisfies the inequality, then shade the region containing that point. Otherwise, shade the other region.
Graph 3x + 4y ≤ 12 using intercepts. Step 1 Find the intercepts. Substitute x = 0 and y = 0 into 3x + 4y = 12 to find the intercepts of the boundary line. y-intercept x-intercept 3x + 4y = 12 3x + 4y = 12 3(0) + 4y = 12 3x + 4(0) = 12 4y = 12 3x = 12 y = 3 x = 4
(0, 3) (4, 0) Step 2 Draw the boundary line. The line goes through (0, 3) and (4, 0). Draw a solid line for the boundary line because it is part of the graph. Step 3 Find the correct region to shade. Substitute (0, 0) into the inequality. Because 0 + 0 ≤ 12 is true, shade the region that contains (0, 0).
(0, –3) Graph 3x – 4y > 12 using intercepts. (4, 0)
Many applications of inequalities in two variables use only nonnegative values for the variables. Graph only the part of the plane that includes realistic solutions. A school carnival charges $4.50 for adults and $3.00 for children. The school needs to make at least $135 to cover expenses. A. Using x as the adult ticket price and y as the child ticket price, write and graph an inequality for the amount the school makes on ticket sales. B. If 25 child tickets are sold, how many adult tickets must be sold to cover expenses?
Adult price times number of adult tickets plus child price times number of child tickets is at least total. 4.50 x + 3.00 y 135 • • Let x represent the number of adult tickets and y represent the number of child tickets that must be sold. Write an inequality to represent the situation. An inequality that models the problem is 4.5x + 3y ≥ 135.
Find the intercepts of the boundary line. 4.5x + 3(0) = 135 4.5(0) + 3y = 135 y = 45 x = 30 Graph the boundary line through (0, 45) and (30, 0) as a solid line. Shade the region above the line that is in the first quadrant, as ticket sales cannot be negative.
_ 4.5x≥ 60, so x ≥ 13.3 If 25 child tickets are sold, 4.5x + 3(25) ≥ 135 Substitute 25 for y in 4.5x + 3y ≥ 135. 4.5x + 75 ≥ 135 Multiply 3 by 25. A whole number of tickets must be sold. At least 14 adult tickets must be sold.
ADVANCED LEVEL Solve for y. Graph the solution. Solve 2(3x – 4y) > 24 for y. Graph the solution.