Download
1 / 35
360 likes | 464 Views
Graph Linear Inequalities. Chapter 2.8. Quick Review of Inequalities. The symbol “<”is an arrowhead pointing left When we write it means, both, that a is to the left of b on the (horizontal) number line, and that a is less than b The symbol “>” is an arrowhead pointing right

E N D
Graph Linear Inequalities Chapter 2.8
Quick Review of Inequalities • The symbol “<”is an arrowhead pointing left • When we write it means, both, that a is to the left ofb on the (horizontal) number line, and that a is less than b • The symbol “>” is an arrowhead pointing right • When we write it means, both, that a is to the right ofb on the (horizontal) number line, and that a is greater than b • The number line need not be oriented horizontally • The y-axis in the coordinate plane is a number line that is oriented vertically
Quick Review of Inequalities • On a vertical number line the symbol “<” means below and it also means less than • When we write it means, both, that a is belowb on the (vertical) number line, and that a is less than b • On a vertical number line the symbol “>” means above and it also means greater than • When we write it means, both, that a is aboveb on the (vertical) number line, and that a is greater than b
Graphing Inequalities • In the inequality , we choose x to represent every value that makes the inequality true • Some of the values that would make this statement true (and could thus replace x) are 3.5, 5, 5.1, 10, 1000000000, and so on • All of these values are to the left of 3
Graphing Inequalities • In the inequality , y represents every number value that is greater than 3 • Some of these values include 3.75, 4.25, , and
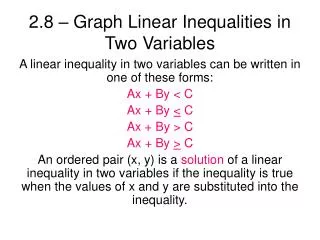
Graphing Linear Inequalities • In this section you will graph linear inequalities • The form of a linear inequality is one of the following • We can use a modified table of values to get an idea of what the graphs of the above look like • Consider the linear inequality
Graphing Linear Inequalities The graph of these points is shown on the next slide
Graphing Linear Inequalities • Recall the difference between, for example, and • In the first case, x includes all values greater than 3, but x cannot be 3 itself • In the second case, x includes all values greater than 3, and x can also be 3 • We represented the difference on a graph with an open circle at 3 for the first case and a closed (filled) circle at 3 for the second case • We need an analogous way to represent the difference between and
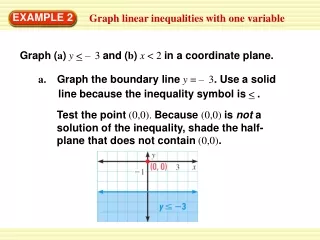
Graphing Linear Inequalities • For the case of , the points that represent solutions are all points above the line , but no points on the line • To show that these points are not included, we draw the line using a dashed line • For the case of , the points that represent solutions are all points above the line , and all points on the line • To show that these points are included, we draw the line with a solid line
Graphing Linear Inequalities : use dashed line : use solid line
Graphing Linear Inequalities • Below are points to remember when graphing linear inequalities • For , draw the dashed line and shade above the line • For , draw the solid line and shade above the line • For , draw the dashed line and shade below the line • For , draw the solid line and shade below the line • Note that we have not yet considered inequalities for horizontal or vertical lines!
Guided Practice Graph the inequality in the coordinate plane. • (HINT: you will have to divide both sides by a negative number!)
Inequalities for Vertical/Horizontal Lines • Recall that a horizontal line has the form and a vertical line has the form • The corresponding inequalities are
Inequalities for Vertical/Horizontal Lines • Graph horizontal inequalities as follows • : draw a dashed line through b on the y-axis and shade above the line • : draw a solid line through b on the y-axis and shade above the line • : draw a dashed line through b on the y-axis and shade below the line • : draw a solid line through b on the y-axis and shade below the line
Inequalities for Vertical/Horizontal Lines • Graph vertical inequalities as follows • : draw a dashed line through aon the x-axis and shade to the right of the line • : draw a solid line through aon the x-axis and shade to the right of the line • : draw a dashed line through aon the x-axis and shade to the left of the line • : draw a solid line through aon the x-axis and shade to the left of the line
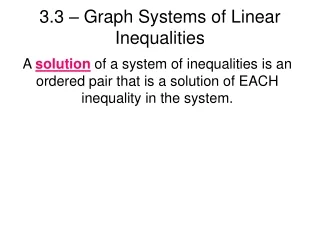
Solutions to Linear Inequalities • For a linear equality (or ), a point is a solution to the equation if, by substituting the values of x and y into the equation, the result is a true statement • This is the same as saying that the point is a point on the graph of • For example, the point is a solution to sinceis a true statement • The point lies on the graph of
Solutions to Linear Inequalities • On the other hand, the point is not a solution to sinceis not a true statement • So the point does not lie on the graph of
Solutions to Linear Inequalities • Similarly, any point that makes the linear inequality (for example) true is a solution to the inequality • This means that the point is in the shaded area • For example, is a solution to sinceis true • In this case, is a solution sinceand is true
Guided Practice Tell whether the given ordered pair is a solution of .
Guided Practice Tell whether the given ordered pair is a solution of . This is a false statement, so this point is not a solution
Guided Practice Tell whether the given ordered pair is a solution of . This is a true statement, so the point is a solution
Guided Practice Tell whether the given ordered pair is a solution of . This is a true statement, so the point is a solution
Guided Practice Tell whether the given ordered pair is a solution of . This statement is false, so the point is not a solution.
Exercise 2.8 • Page 135, #3-18