Download
1 / 40
400 likes | 516 Views
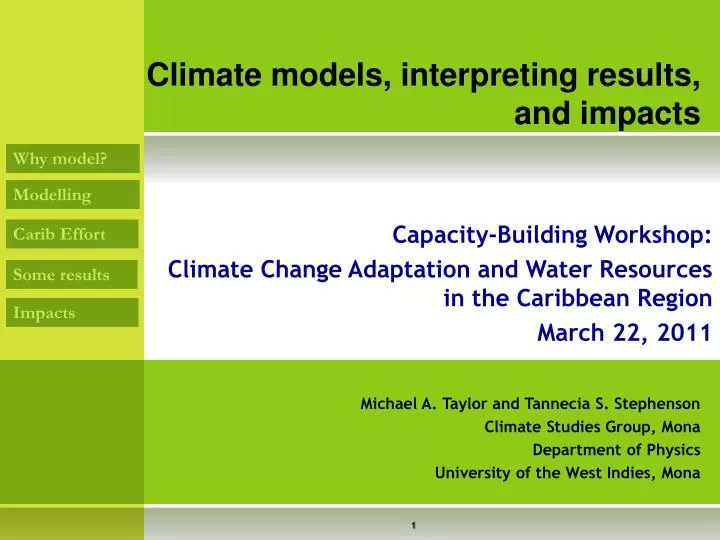
Climate models, interpreting results, and impacts. Why model?. Modelling. Capacity-Building Workshop: Climate Change Adaptation and Water Resources in the Caribbean Region March 22, 2011. Carib Effort. Some results. Impacts. Michael A. Taylor and Tannecia S. Stephenson

E N D
Climate models, interpreting results, and impacts Why model? Modelling Capacity-Building Workshop: Climate Change Adaptation and Water Resources in the Caribbean Region March 22, 2011 Carib Effort Some results Impacts Michael A. Taylor and Tannecia S. Stephenson Climate Studies Group, Mona Department of Physics University of the West Indies, Mona
3 Reasons for Modelling… Why model? 1. The Caribbean is climate sensitive… Modelling • Our lives and livelihood revolve around or are closely linked to climate. • Economic: E.g. Tourism, agriculture, mining, fishing • Infrastructure: E.g. Location of major cities, water quality and storage • Recreation • Wellbeing/health • Size and topography enhances sensitivity:E.g. Hilly backbone, limited landspace, infrastructure few miles from coast. Carib Effort Some results Impacts
3 Reasons for Modelling… Why model? 2. The Caribbean is therefore vulnerable… Modelling • Changes in climate (short term or long term) can and do alter Caribbean existence. • Droughts and floods; • Hurricanes; • Hot days, nights, • Long term climate change etc. • Impact felt throughout many areas of Caribbean life directly or indirectly: • Agriculture, Health, Water, Tourism, Disaster Management/Infrastructure, Sport, Finance Carib Effort Some results Impacts
3 Reasons for Modelling… Why model? 2. The Caribbean is however not helpless… Modelling If we could anticipate the change in climate then we could better plan for it. Modelling gives us a clue into the long term changes in climate. So why model? To build climate resilience by: - offering insight into likely ways the climate might change in our region - enabling the use of this knowledge for planning purposes. Carib Effort Some results Impacts
Premise… Why Model? • Climate has been changing due primarily to human activity – primarily through the addition ofgreenhouse gases. Modelling Carib Effort Some results • The result is the earth has warmed over the last century - Earth is 0.75 degrees warmer than in 1860. Impacts • Rising temperatures result in other effects e.g. sea level rise and changing rainfall patterns
Premise… Why Model? • Suppose we could guess how the concentrations of greenhouse gases will change going into the future scenarios Modelling Carib Effort Some results • Put these concentrations in computer models that simulate all the physical processes of the earth. So what? models • Generate pictures of how the climate of the earth, or region on the earth will look in the future. projections
Modelling… Why Model? Modelling Carib Effort Some results Impacts Models + Scenarios = Future Climate Computer simulations of future climates given conjectures of how the greenhouse gases will change going to the end of the century.
Caribbean Modelling Initiative Why Model? • In 2003 a group of modellers got together in Havana Cuba. • 4 Countries: Jamaica, Cuba, Babados, Belize • 4 Institutions: UWI (Cave Hill), UWI (Mona), INSMET, CCCCC • Disheartened that no model projections existed for Caribbean and at scale of Caribbean. • Deliberate collaborative effort to produce Caribbean climate projections at scale of Caribbean. • Premised on shared workload to get results out quickly. • Premised on building of capacity in the region. Modelling Carib Effort Some results Impacts
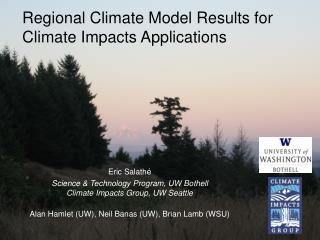
Caribbean Modelling Initiative Why Model? • Chose a DOMAIN • All of Caribbean • Run at 50 km • Smaller domains at 25 km • Chose a MODEL • PRECIS - Providing REgional Climates for Impact Studies • Hadley Centre, UK Modelling Carib Effort Some results • Dynamical Downscaling Model (RCM) • Driven by the HADAM3P GCM and ECHAM but can be forced at its boundaries by other GCM’s • Has a resolution of up to 25km • Built by UK Hadley Centre but run locally • Can be used for any part of the Globe Impacts
Caribbean Modelling Initiative Why Model? • Chose SCENARIOS • IPCC SRES Scenarios • A2 (high emissions) and B2 (low emissions) • Divided up the runs • Considered capacity • Considered available computing power • Considered interest Modelling Carib Effort Some results Impacts
Caribbean Modelling Initiative Why Model? • Chose Methodology • Simulate historical conditions (e.g. 1970-present) • Simulate future conditions under scenarios (end of century) • Determine absolute or percentage change between future and present. Modelling Carib Effort Some results Impacts
Caribbean Modelling Initiative Why Model? PRECIS Project Timeline Modelling Carib Effort Some results Impacts 2003 2004 2005 2006 2007 2008 2009 Sept: Initial Cuba meeting Apr: Runs restartedDec: Space limitations noted Analysis and publications New runs begun Sept: Computers purchased.Oct: Runs initiated Nov: Start of computer woes Aug: All initial runs completed. Analysis begun
Warmer Temperatures Why Model? Irrespective of scenario the Caribbean expected to warm.Warming between 1 and 5oC Warming greater under A2 scenario. Warming consistent with projections for other parts of globe. Warming far exceeds natural variability A2 Modelling Carib Effort Some results Impacts B2 Mean changes in the annual mean surface temperature for 2071-2099 with respect to 1961-1989, as simulated by PRECIS (ECHAM) and PRECIS (HADCM3) for SRES A2 (high emissions) and SRES B2 (low emissions).
Warmer Temperatures Idea of scales at which information can be provided Why Model? Irrespective of scenario the Caribbean expected to warm.Warming between 1 and 5oC Warming greater under A2 scenario. Warming consistent with projections for other parts of globe. Warming far exceeds natural variability Modelling Carib Effort Some results Impacts Mean changes in the annual mean surface temperature for 2071-2099 with respect to 1961-1989, as simulated by PRECIS_Had for SRESA2.
Warmer Temperatures – Country level Why Model? Irrespective of scenario the Caribbean expected to warm.Warming between 1 and 5oC Warming greater under A2 scenario. Warming consistent with projections for other parts of globe. Warming far exceeds natural variability Modelling Carib Effort Some results Impacts Examples of future projections of average absolute temperature change (degrees C) for the period 2071-2099 using the PRECIS (Hadley) model. Each column contains a range of values across the A2 and B2 scenarios.
Temperature Conclusion In the future, the Caribbean is very likely to be: HOTTER!! Why Model? Modelling Carib Effort Some results Impacts
Warmer Temperatures – Results from other approaches Substantial increases in the frequency of days and nights that are considered ‘hot’ in current climate by the 2090s. (McSweeney et al. 2008) Decreases in the frequency of days and nights that are considered ‘cold’ in current climate. (McSweeney et al. 2008). Temperatures are projected to increase at 3 stations located in Trinidad, Jamaica and Barbados by the end of century from statistical downscaling (Chen et al. 2006).
Less Rainfall Why Model? General tendency for drying (main Caribbean basin) by end of the century.Drying between 25% and 30% Possibly wetter far north Caribbean NDJ and FMA. Drying exceeds natural variability June-October – wet season dryer! A2 Modelling Carib Effort Some results Impacts B2 Mean changes in the annual rainfall for 2071-2099 with respect to 1961-1989, as simulated by PRECIS (ECHAM) and PRECIS (HADCM3) for SRES A2 (high emissions) and SRES B2 (low emissions).
Less Rainfall Why Model? General tendency for drying (main Caribbean basin) by end of the century.Drying between 25% and 30% Possibly wetter far north Caribbean NDJ and FMA. Drying exceeds natural variability June-October – wet season dryer! Modelling Carib Effort Some results Impacts Mean changes in the annual rainfall for 2071-2099 with respect to 1961-1989, as simulated by PRECIS (HADCM3) for SRES A2 and SRES B2.
How certain? Why Model? Modelling Multiple uncertainties in modelsConsensus diagrams useful In some regions, all scenarios predict drier. In some regions all simulations predict wetter. Carib Effort Some results Impacts Number of simulations projecting precipitation increase for 2080s.
Rainfall – Conclusion In the future, Caribbean is very likely to be: DRIER !! Why Model? Modelling Carib Effort Some results Impacts
Rainfall – Results from Other Approaches Statistically downscaled results for stations in Jamaica show a summer rainfall decrease through the 2080s but an increase for the analyzed stations in Trinidad and Barbados (Chen et al. 2006). The proportion of total rainfall that falls in heavy events for the Caribbean islands decreases in most GCM model projections (McSweeney et al. 2008). Why Model? Modelling Carib Effort Some results Impacts
Other parameters… Why Model? Modelling Vertical Shear Carib Effort Some results Impacts Hurricanes? Cloud Cover
All results… Why Model? Modelling Carib Effort Some results Impacts User friendly website All results User specify desired variables and future period. Multiple plot types. predict wetter. http://precis.insmet.cu/Precis-Caribe.htm
Rising Sea Levels By the end of the century under an A1B scenario (emissions are somewhere between A2 and B2 values), global sea levels are expected to rise by 0.21 to 0.48 meters (IPCC 2007). If ice flow dynamics considered IPCC estimates may at least double (e.g. Vermeer and Rahmstorf 2009) Recent studies also suggest that sea level rise in the Caribbean may be more pronounced than in other regions because of its proximity to the equator (e.g. Bamber et al. 2009). Why Model? Modelling Carib Effort Some results Impacts
Rising Sea Levels Simpson et al. (2010) examine the consequences of 1 and 2 m sea level rise in the Caribbean, which they consider to not be unreasonable estimates by the end of the century. They note that even if GHGs emissions were stabilized now SLR would continue to rise beyond the end of the century, and suggest that ‘the question is not if the Caribbean will face SLR of 1m or 2m under either a 2.0°C or 2.5°C global warming scenario, but rather when’. Why Model? Modelling Carib Effort Some results Impacts
Climate Will Change......Sea Level Rise • The Caribbean is projected to experience greater SLR than most areas of the worlddue to its location closer to the equator and related gravitational and geophysical factors. • Even in the absence of increased intensity or frequency of tropical storms and hurricanes, SLR will intensify their impact on coastlines in the Caribbean. • SLR will continue for centuries after 2100, even if global temperatures are stabilised at 2°C or 2.5°C and therefore represents a chronic and unidirectional, negative threat to coastal areas in the Caribbean and globally. • UNDP/CASRIBSAVE (2010)
We Are At Risk Impacts from a 1m SLR on CARICOM nations - UNDP/CARIBSAVE (2010) Nearly 1,300 km2 land area lost (e.g., 5% of The Bahamas, 2% Antigua and Barbuda, 1% T&T). Over 100,000 people displaced (e.g., 5% of population in The Bahamas, 3% Antigua and Barbuda, 1% T&T). At least 149 multi-million dollar tourism resorts damaged or lost, with beach assets lost or greatly degraded at many more tourism resorts (33% T&T). Damage or loss of 5 power plants (0% T&T) Over 1% agricultural land lost, with implications for food supply and rural livelihoods (e.g., 5% in Dominica, 6% in The Bahamas, 3% T&T). Inundation of known sea turtle nesting beaches (e.g., 35% in The Bahamas and St. Kitts and Nevis, 44% in Belize and Haiti, 50% in Guyana, 15% T&T). Transportation networks severely disrupted. Loss or damage of 21 (28%) CARICOM airports (50% T&T). Lands surrounding 35 ports inundated (out of 44) (100% T&T).. Loss of 567 km of roads (e.g., 14% of road network in The Bahamas, 12% Guyana, 14% in Dominica, 1% T&T).
More Intense Hurricanes It is likely that with increased sea surface temperatures ‘future tropical cyclones (typhoons and hurricanes) will become more intense, with larger peak wind speeds and more heavy precipitation’ (IPCC 2007). There is less consensus on frequency. Much more research needs to be done to arrive at a consensus on hurricane trends. This is work we are currently undertaking. Why Model? Modelling Carib Effort Some results Impacts
Next steps Adaptation hinges on more specific knowledge of threat within each sector, more than what is currently available. Coordinated data gathering and research, particularly research which defines the climate-sectoral linkages are needed. A research agenda must be a feature of adaptation response. There is sufficient information available to begin addressing questions on the impacts of climate change in individual sectors. Some of this work is already underway . . . . Why Model? Modelling Carib Effort Some results Impacts
Next steps How do we use the climate change information to help us identify adaptation strategies? Four steps: 1. Identify the link (between climate and sector). 2. Look at how climate will change 3. Identify likely change in sector 4. Propose adaptation strategy Why Model? Modelling Carib Effort Some results Impacts
Next steps –Health Example: Dengue Case Study Increased dengue fever associated with warmer temperatures (Chen et al., 2006). Study included data gathering and analysis to make the climate sectoral linkage, assessment of vulnerability and likely impact of the projected change. Impacts of projected change used to craft a raft of possible adaptation strategies ranging from public education alone to scientific, technical and behavioural solutions dependent on the availability of resources. Study also makes the important point that the responsibility for adaptation lies at all levels - individual, community and national levels. Why Model? Modelling Carib Effort Some results Impacts
Next steps – Health Example Why Model? Modelling Carib Effort Some results Impacts
Next steps – Water Resources Example Why Model? Modelling Carib Effort Some results Impacts
Next steps- Water Resources ExampleJamaica A National Adaptation Strategy for water was examined for Jamaica – MACC initiative 1. Climate Change It is very likely that Jamaica will become warmer by the 2050s and 2080s. It is likely that Jamaica will become drier in the mean and particularly in June-August by the 2050s and 2080s. Based on multiple approaches – global model output, PRECIS model output and statistical downscalling (rainfall and streamflow) Why Model? Modelling Carib Effort Some results Impacts
Next steps- Water Resources ExampleJamaica 2. Main threats to sector as a consequence of the climate change scenarios Water Supply: Increasing length of dry season will particularly impact communities affected by low drought yields. Increasing frequency of intense rains will impact sediment loads and treatment capability Flooding Regimes: In highland areas of slope instability increased landslides and flooding can be expected. High turbidity and damaged distribution infrastructure Why Model? Modelling Carib Effort Some results Impacts
Next steps- Water Resources ExampleJamaica 3. Propose Adaptation Strategy Although the impacts of climate change on the water sector are wide-ranging and significant, there are a number of positive measures that can be taken to increase the adaptive capacity of the sector. (i) Investment in hydrological and water quality monitoring and dissemination of data to the stakeholder community (ii) Development of appropriate hydrological and water resources modeling tools in parallel with capacity building within key stakeholder organizations Why Model? Modelling Carib Effort Some results Impacts
Next steps? Why Model? More Analysis Modelling Lots of data generated over the years. Get it out there. Analysis left to be done: Validation Extreme Analysis Dynamics Hurricanes Haven’t begun to look at impacts on other sectors. Carib Effort Some results More Models and Modeling Impacts Must offer multiple realisations of the future. One way is to use different regional models. PRECIS but one option. More Partnerships Too difficult, time consuming for any one country or institution. Collaboration heightens efficiency for producing usable results. Builds synergies/support groups across institutions. Collaborate with non-English speaking Caribbean
Discernible impacts Why Model? Transforming our talk: Modelling in the Caribbean is moving us from general, hypothetical conversations on climate change premised on studies not done in or for the Caribbean to more contextually relevant science language. Modelling Carib Effort Some results • Access Answers • Modelling in the Caribbean is enabling us to answer our own impact and vulnerability questions (e.g impact of climate change on dengue fever, or sugar cane crops, or river streamflows in eastern Jamaica, etc.) Or… • Modelling enabling region to address our sustainable development issues. Impacts
END Why Model? Modelling Carib Effort Some results Thank You Impacts