Download
1 / 12
120 likes | 290 Views
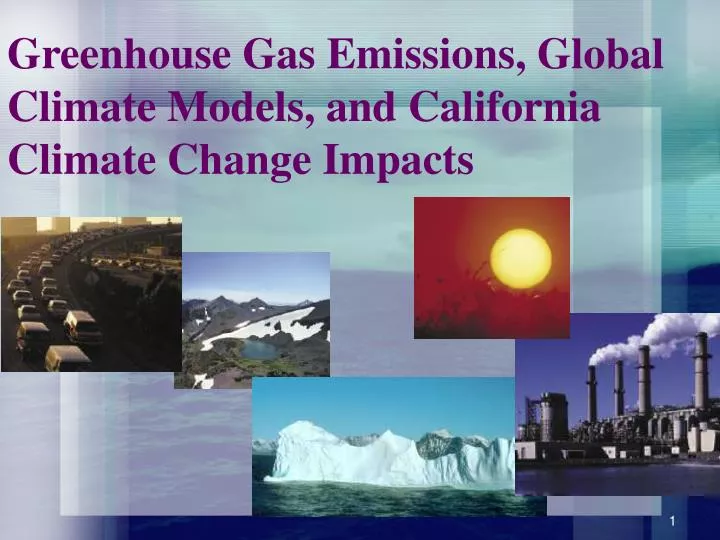
Greenhouse Gas Emissions, Global Climate Models, and California Climate Change Impacts. Global mean air temperature by 10 GCMs identically forced with CO 2 increasing at 1%/year for 80 years. GCM Selection. The projected future climate depends on the Global Climate Model (GCM) used:

E N D
Greenhouse Gas Emissions, Global Climate Models, and California Climate Change Impacts
Global mean air temperature by 10 GCMs identically forced with CO2 increasing at 1%/year for 80 years GCM Selection • The projected future climate depends on the Global Climate Model (GCM) used: • Different parameterization of physical processes (e.g., clouds, precipitation) • Varying sensitivity to changes in atmospheric forcing (e.g. CO2, aerosol concentrations)
Impacts Future GHG Emissions Scenarios of CO2 emissions Lag • How society changes in the future: • “Scenarios” of greenhouse gas emissions: • A1fi: Rapid economic growth and introduction of new, efficient technologies, technology emphasizes fossil fuels – Highest estimate of IPCC • A2: Technological change and economic growth more fragmented, slower, higher population growth – Less high for 21st century • B1: Rapid change in economic structures toward service and information, with emphasis on clean, sustainable technology. Reduced material intensity and improved social equity - Lowest estimate for 21st century CO2 concentrations
GCM Selection – Model Characteristics • GFDL 2.1 – Geophysical Fluid Dynamics Lab, resolution about 2.0 x 2.5 degrees (latitude x longitude) • PCM – National Center for Atmospheric Research/Dept. of Energy Parallel Climate Model, resolution about 2.8 degrees • Model Characteristics: • Both are Coupled Atmosphere-Ocean-Land models • Neither uses flux adjustments: can simulate stable climate without adjustments • Both are state-of-the-art • Participating in IPCC AR4 simulations archived at PCMDI, archiving daily data • realistic simulation El Niño SST anomalies – important for CA climate
Difference between all GCMs Difference between all GCMs 1ºC 2ºC 3ºC 4ºC 5ºC PCM GFDL PCM GFDL Difference Between GCMs Difference Between GCMs Difference Between B1 and A2 GCM Selection – Sensitivity Average Annual T change over CA B1 Emission Scenario A2 Emission Scenario At end of 21st Century: GFDL slightly drier PCM slightly wetter
Using GCMs in Impact Studies • The problems: • GCM spatial scale incompatible with local/regional processes • roughly 2 – 5 degrees resolution • some important processes not captured • GCMs have biases • Resolved by: • Bias Correction • Spatial Downscaling
Bias Correction Effects • Mean and variability of observed data are reproduced for historical period • Temperature trends into future in GCM output are preserved • Relative changes in mean and variance in future period GCM output are preserved, mapped onto observed variance
Spatial Disaggregation GFDL – A2 Scenario Assumes processes responsible for current precipitation pattern also apply to future precipitation
Results for CA – Annual Average Annual P trend small, though impacts can be sensitive T trend strongly influenced by GHG emission scenario and GCM For PCM, A1fi scenario is 1-2 ºC warmer than A2.
Temperature Changes, ºC 1961-1990 GFDL-B1 PCM-B1 GFDL-A2 PCM-A2
Precipitation Changes, mm/d 1961-1990 GFDL-B1 PCM-B1 GFDL-A2 PCM-A2 1 mm/d 14 inches/year
Derived data for impact modelers • Downscaled GCM climate and derived meteorology • precipitation • temperature • humidity • radiation • Hydrologic model simulations for specific river basins, have produced: • streamflow • snowpack • snowmelt timing • soil moisture