Download
1 / 54
580 likes | 977 Views
Signal & Linear system. Chapter 2 Time Domain Analysis of CT System Basil Hamed. 2.1 Introduction. Systems described by Linear, Constant-Coefficient Differential Equations are Continuous-Time, Linear Time-Invariant (LTI) Systems. Differential equations like this are LTI.

E N D
Signal & Linear system Chapter 2 Time Domain Analysis of CT System Basil Hamed
2.1 Introduction Systems described by Linear, Constant-Coefficient Differential Equations are Continuous-Time, Linear Time-Invariant (LTI) Systems Differential equations like this are LTI • coefficients (a’s & b’s) are constants ⇒TI • No nonlinear terms ⇒Linear Basil Hamed
2.1 Introduction Many physical systems are modeled w/ Differential Eqs–Because physics shows that electrical (& mechanical!) components often have “V-I Rules” that depend on derivatives This is what it means to “solve” a differential equation!! However, engineers use Other Math Models to help solve and analyze differential eqs–The concept of “Frequency Response” and the related concept of “Transfer Function” are the most widely used such math models>“Fourier Transform” is the math tool underlying Frequency Response–Another helpful math model is called “Convolution” Basil Hamed
2.1 Introduction Relationships Between System Models • These 4 models all are equivalent • …but one or another may be easier to apply to a given problem Basil Hamed
2.1 Introduction Example System: RC Circuit System You’ve seen in Circuits Class that R, L, C circuits are modeled by Differential Equations: • From Physical Circuit…get schematic • From Schematic write circuit equations…get Differential Equation • Solve Differential Equation for specific input…get specific output Basil Hamed
2.1 Introduction “Schematic View”: “System View”: Circuits class showed how to model this physical system mathematically: Basil Hamed
2.2 Continuous-Time Domain Analysis For a linear system, • The two components are independent of each other Each component can be computed independently of the other Basil Hamed
2.2 Continuous-Time Domain Analysis • Zero-state response • Response to non-zero f(t) when system is relaxed • A system in zero state cannot generate any response for zero input. • Zero state corresponds to initial conditions being zero. • Zero-input response • Response when f(t) = 0 • Results from internal system conditions only • Independent of f(t) • For most filtering applications (e.g. your stereo system), we want no zero-input response. Basil Hamed
2.2 Continuous-Time Domain Analysis -Consider that the input “starts at t= t0”:(i.e. x(t) = 0 for t< t0) -Let y(t0) be the output voltage when the input is first applied (initial condition) -Then, the solution of the differential equation gives the output as: Recall :This part is the solution to the “Homogeneous Differential Equation” 1.Set input x(t) = 0 2.Find characteristic polynomial (Here it is λ+ 1/RC) 3.Find all roots of characteristic polynomial: λi(Here there is only one) 4.Form homogeneous solution from linear combination of the exp {λi(t-to)} 5.Find constants that satisfy the initial conditions (Here it is y(t0) ) Basil Hamed
2.2 Continuous-Time Domain Analysis In this course we focus on finding the zero-state response (I.C.’s= 0) Later will look at this general form…It’s called “convolution” Basil Hamed
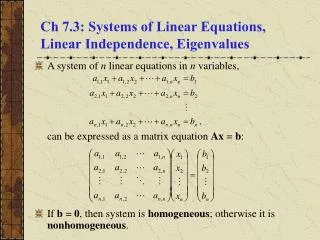
2.2 Linear Constant-Coefficient Differential Equations General Form:(Nth-order) Input: x(t) Output: y(t) • Solution of the Differential Equation Recall: Two parts to the solution (i) one part due to ICs with zero-input (“zero-input response”) (ii) one part due to input with zero ICs (“zero-state response”) “Homogeneous Solution” Basil Hamed
2.2 Linear Constant-Coefficient Differential Equations Then: y(t) = yZI(t) + yZS(t) (yzs(t) is our focus, so we will often say ICs = 0) Basil Hamed
2.2 Linear Constant-Coefficient Differential Equations So how do we find yZS(t)? If you examine the zero-state part for all the example solutions of differential equations we have seen you’ll see that they all look like this: This is called “Convolution” So we need to find out: Given a differential equation, what is h(t-λ) Basil Hamed
2.2 Linear Constant-Coefficient Differential Equations Ex. Find the zero-input component of the response, for a LTI system described by the following differential equation: ( when the initial conditions are . • For zero-input response, we want to find the solution to: • The characteristic equation for this system is therefore: • ( • The characteristic roots are therefore. • The zero-input response is Basil Hamed
2.2 Linear Constant-Coefficient Differential Equations To find the two unknowns c1 and c2, we use the initial conditions • This yields to two simultaneous equations: • Solving this gives: • Therefore, the zero-input response of y(t) is given by: Basil Hamed
2.3 Unit Impulse response h(t) Impulse response of a system is response of the system to an input that is a unit impulse Impulse Response: h(t) is what “comes out” when δ(t) “goes in” Use h(t) to find the zero-state response of the system for an input Basil Hamed
2.4 System Response to external Input: Zero-State Response • The Sifting Property of δ(t): Above eq. shows that the impulse function sifts out everything except the value of x(t) at t=t0 Basil Hamed
2.4 System Response to external Input: Zero-State Response Approximate any input x(t) as a sum of shifted, scaled pulses Above figure shows that any signal x(t) can be expressed as a continuum of weighted impulses Basil Hamed
2.4-1 The Convolution Integral CONVOLUTION y(t)= x(t) * h (t) = h(t) * x(t) Basil Hamed
Properties of the Convolution: • Commutative: x(t) * h(t)= h(t) * x(t) • Associative: x(t) * h1(t) * h2(t)= [x(t)*h1(t)]*h2(t) [x(t)*h2(t)]*h1(t) 3. Distributive: x(t)*[h1(t)+h2(t)]=[x(t)*h1(t)]+[x(t)*h2(t)] 4. Convolution with an impulse: x(t)*δ(t)= x(t) 5. Convolution with Unit step: x(t)*u(t)= Basil Hamed
DISTRIBUTIVITY Basil Hamed
Associative Basil Hamed
Examples of Convolution Find u(t) * u(t) y(t)=u(t)*u(t)= Ex 2. P 175 Find y(t) Basil Hamed
Examples of Convolution y(t)= x(t)* h(t)= Note that u = 0 Otherwise Basil Hamed
Examples of Convolution Ex. Use direct integration, find the expression for Solution: Because both functions are casual, their convolution is zero for t < 0 Basil Hamed
Examples of Convolution Ex 2.6 P 178 Find y(t) Solution: • Note that u • = 0 Otherwise Basil Hamed
Examples of Convolution y Basil Hamed
Examples of Convolution Ex. A first-order lowpassfilter impulse response is given by Find the zero-state response of this filter for the input Solution: Basil Hamed
Examples of Convolution From convolution table on Page 177 Basil Hamed
Graphical Convolution Operation Graphical convolution allows us to grasp visually or mentally the convolution integral’s result. Many signals have no exact mathematical description, so they can be described only graphically. We’ll learn how to perform “Graphical Convolution,” which is nothing more than steps that help you use graphical insight to evaluate the convolution integral. Basil Hamed
Steps for Graphical Convolution x(t)*h(t) 1. Re-Write the signals as functions of : x() and h() 2. Flip just one of the signals around t = 0 to get either x(-) or h(-) a. It is usually best to flip the signal with shorter duration b. For notational purposes here: we’ll flip h() to get h(-) 3. Find Edges of the flipped signal a. Find the left-hand-edge τ-value of h(-) b. Find the right-hand-edge τ-value of h(-) 4. Shift h(-) by an arbitrary value of t to get h(t-) and get its edges a. Find the left-hand-edge -value of h(t-) as a function of t b .Find the right-hand-edge -value of h(t-) as a function of t Basil Hamed
Steps for Graphical Convolution x(t)*h(t) 5. Find Regions of -Overlap a. What you are trying to do here is find intervals of t over which the product x() h(t-) has a single mathematical form in terms of b. In each region find: Interval of t that makes the identified overlap happen c. Working examples is the best way to learn how this is done 6. For Each Region: Form the Product x() h(t-) and Integrate a. Form product x() h(t-) b. Find the Limits of Integration by finding the interval of over which the product is nonzero c. Integrate the product x() h(t-) over the limits found in b 7. “Assemble” the output from the output time-sections for all the regions Basil Hamed
Graphically Convolve Two Signals Ex. Convolve these two signals: Basil Hamed
Graphically Convolve Two Signals Step #1: Write as Function of Usually Step #2: Flip h (τ) to get h (-τ) Basil Hamed
Graphically Convolve Two Signals Step #3: Find Edges of Flipped Signal Edges Basil Hamed
Graphically Convolve Two Signals Step #4: Shift by t to get h(t-) & Its Edge Basil Hamed
Graphically Convolve Two Signals Step #5: Find Regions of τ-Overlap Basil Hamed
Graphically Convolve Two Signals Step #5: Find Regions of τ-Overlap Basil Hamed
Graphically Convolve Two Signals • Step #5: Find Regions of τ-Overlap Basil Hamed
Graphically Convolve Two Signals Step #6: Form Product & Integrate For Each Region Basil Hamed
Graphically Convolve Two Signals • Step #6: Form Product & Integrate For Each Region Basil Hamed
Graphically Convolve Two Signals Step #6: Form Product & Integrate For Each Region Basil Hamed
Graphically Convolve Two Signals Step #7: “Assemble”Output Signal Basil Hamed
Examples Ex. Solution: y(t)=x(t)* h(t) Basil Hamed
Examples Region I: Region II: Basil Hamed
Examples Ex. given Find y(t) Solution x(t) = 1, for 1≤t≤3 = 0, elsewhere h(t) = t+2, for -2≤t≤-1 = 0, elsewhere Basil Hamed
Examples Basil Hamed