Download
1 / 6
100 likes | 244 Views
1 2 3 4. Stem and Leaf Diagrams. Stem and leaf diagrams are a pictorial way of showing statistics The important parts of a stem and leaf diagram are. The Title. Class Maths Marks. 0 2 2 6 8 3 4 9 5 9 0 0 2 6 8 9 9 0 4 5. The stem.

E N D
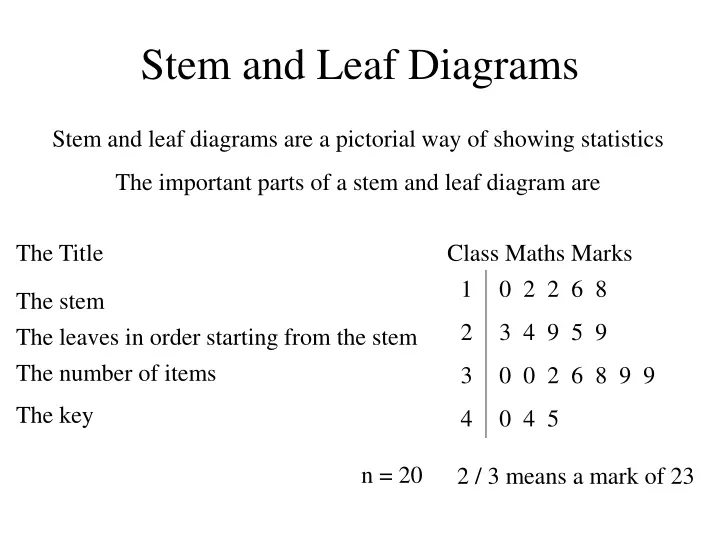
1 2 3 4 Stem and Leaf Diagrams Stem and leaf diagrams are a pictorial way of showing statistics The important parts of a stem and leaf diagram are The Title Class Maths Marks 0 2 2 6 8 3 4 9 5 9 0 0 2 6 8 9 9 0 4 5 The stem The leaves in order starting from the stem The number of items The key n = 20 2 / 3 means a mark of 23
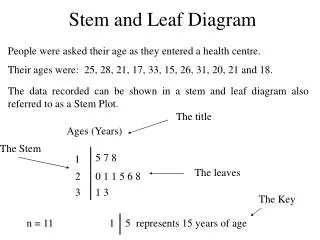
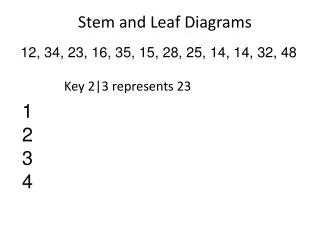
5 6 7 A group of students measured their pulse rates in beats per minute. The results were. 66 69 62 58 74 56 67 72 61 62 59 60 72 58 63 Draw a Stem and Leaf diagram to show this We need a title Pulse rates (beats per minute) We need the stems 8 6 9 8 6 9 2 7 1 2 0 3 4 2 2 6 8 8 9 0 1 2 2 3 6 7 9 2 2 4 We need the Leaves We need to reorder the leaves We need to write in n n = 15 6 / 2 means 62 beats per minute We need the key
Pocket money 5 6 7 6 8 8 9 0 1 2 2 3 6 7 9 2 2 4 n = 15 6 / 2 means £6.20 A group of students were asked how much pocket money they get. The results were. £6.60 £6.90 £6.20 £5.80 £7.40 £5.60 £6.70 £7.20 £6.10 £6.20 £5.90 £6.00 £7.20 £5.80 £6.30 Draw a Stem and Leaf diagram to show this Note this gives us the same diagram as the previous example. This shows the importance of the title and key.
Speed in mph 3 2 4 5 6 7 8 9 4 2 2 6 8 8 1 1 3 3 8 6 0 n = 18 4/3 means 43mph Distance in metres 10 1 5 8 11 1 2 5 8 12 0 1 1 2 7 7 9 9 13 1 2 6 7 8 9 n = 21 12/3 means 123m Draw Stem and Leaf Diagrams for the following sets of data The speed of cars, in mph, passing police speed check 35 46 32 48 53 58 60 39 36 48 34 51 42 37 53 42 51 38 John took a note of how far, in metres, he was able to hit a golf ball 108 115 132 121 101 122 138 127 105 112 118 127 129 120 139 136 131 121 111 129 137
Maths marks for class 1A Maths marks for class 1B 8 8 5 3 9 4 4 5 2 0 6 4 3 1 1 0 7 3 3 0 1 2 3 4 6 8 9 1 2 2 2 5 5 8 0 0 1 1 6 7 3 7 7 1 n = 19 3/2 means a mark of 32 n = 20 How many students in 1A had a mark of 31? How many students in 1B had a mark of 12? Which class appears to be best at Maths? Stem and Leaf diagrams can be used to compare 2 sets of data. To do this we draw a back to back stem and leaf diagram. 2 3 1A
Books borrowed from the library This week Last week 2 0 1 4 1 3 1 5 6 7 4 4 3 4 0 4 5 1 0 5 2 4 1 6 3 n = 10 n = 10 2/0 represents 20 books Use the Back to Back Stem and Leaf Diagram to answer the questions 65 ? How many books were borrowed at level 3 this week 129 ? How many books were borrowed at level 4 last week This week ? Which week was best for the library 387 ? How many books were borrowed last week altogether