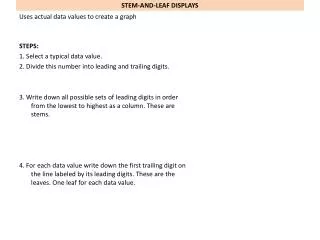
Download
1 / 26
280 likes | 441 Views
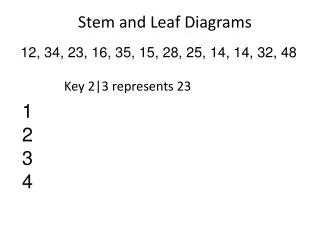
Stem and leaf diagrams. They really are as simple as they seem. Simply a way of showing the values of data. Here are the weights of some aardvarks (kg): 12, 28, 17, 17, 19, 23, 9, 7, 25, 34, 21. Stem and leaf might look like this: Weight of aardvarks 0 9, 7 2, 7, 7, 9,

E N D
Here are the weights of some aardvarks (kg): 12, 28, 17, 17, 19, 23, 9, 7, 25, 34, 21 Stem and leaf might look like this: Weight of aardvarks 0 9, 7 2, 7, 7, 9, 8, 3, 5, 1 KEY 4 1 2 is 12kg Example…….. STEM LEAF OR LEAVES Don’t need to write this usually
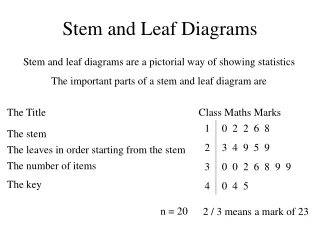
Your ‘stem and leaf’ must have a… • Title • Key – so that other people can work out what your values are.
An ordered ‘stem and leaf’…. Has the values in size order.
Weight of aardvarks 0 9, 7 2, 7, 7, 9, 8, 3, 5, 1 KEY 4 1 2 is 12kg The ordered ‘stem and leaf’ would be: Weight of aardvarks 0 7, 9 2, 7, 7, 9, 1, 3, 5, 8 KEY 4 1 2 is 12kg So for our example before… What weight does the ‘5’ represent?
I.Q. scores of Year 10 girls: 105, 98, 112, 94, 130, 121, 98, 104, 100, 108, 112, 104, 101, 97, 104 I.Q. scores of Year 10 girls 9 8, 4, 8, 7 10 5, 4, 0, 8, 4, 1, 4 11 2, 2 12 1 13 0 KEY 11 2 means 112 Show the following data as a stem and leaf diagram
I.Q. scores of Year 10 girls (unordered) 9 8, 4, 8, 7 10 5, 4, 0, 8, 4, 1, 4 11 2, 2 12 1 13 0 KEY 11 2 means 112 I.Q. scores of Year 10 girls (ordered) 9 4, 7, 8, 8 10 0, 1, 4, 4, 4, 5, 8 11 2, 2 12 1 13 0 KEY 11 2 means 112 Now ‘order it’
I.Q. scores of Year 10 girls (ordered) 9 4, 7, 8, 8 10 0, 1, 4, 4, 4, 5, 8 11 2, 2 12 1 13 0 KEY 11 2 means 112 Mode – most common In this case 104 Mode….
I.Q. scores of Year 10 girls (ordered) 9 4, 7, 8, 8 10 0, 1, 4, 4, 4, 5, 8 11 2, 2 12 1 13 0 KEY 11 2 means 112 Highest value – lowest value In this case: Range = 130 – 94 = 36 Range ….
I.Q. scores of Year 10 girls (ordered) 9 4, 7, 8, 8 10 0, 1, 4, 4, 4, 5, 8 11 2, 2 12 1 13 0 KEY 11 2 means 112 Put in size order (already done); then find the middle value In this case we have 15 values so we want the median = 104 Median …. 8th value along
I.Q. scores of Year 10 girls (ordered) 9 4, 7, 8, 8 10 0, 1, 4, 4, 4, 5, 8 11 2, 2 12 1 13 0 KEY 11 2 means 112 Put in size order (already done); then find the value a quarter of the way up In this case we have 15 values so we want the Lower quartile = 98 Lower Quartile …. 4th value along
I.Q. scores of Year 10 girls (ordered) 9 4, 7, 8, 8 10 0, 1, 4, 4, 4, 5, 8 11 2, 2 12 1 13 0 KEY 11 2 means 112 Put in size order (already done); then find the value three- quarters of the way up In this case we have 15 values so we want the Upper quartile = 112 Upper Quartile …. 12th value along
90 100 110 120 130 I.Q. Score You now know enough to be able to draw a ‘box and whisker diagram’ Smallest value Largest value median Lower quartile upper quartile
I.Q. scores of Year 10 boys: 103, 98, 112, 99, 108, 122, 98, 104, 100, 108, 112, 104, 101, 97, 104, 108, 99, 108, 102 I.Q. scores of Year 10 boys 9 8, 9, 8, 7, 9 10 3,8,4,0,8,4,1,4,8,8,2 11 2, 2 12 2 KEY 11 2 means 112 Show the following data as a stem and leaf diagram
I.Q. scores of Year 10 boys (unordered) 9 8, 9, 8, 7, 9 10 3,8,4,0,8,4,1,4,8,8,2 11 2, 2 12 2 KEY 11 2 means 112 I.Q. scores of Year 10 boys (ordered) 9 7, 8, 8, 9, 9 10 0,1,2,3,4,4,4,8,8,8,8 11 2, 2 12 2 KEY 11 2 means 112 Now ‘order it’
I.Q. scores of Year 10 boys 9 7, 8, 8, 9, 9 10 0,1,2,3,4,4,4,8,8,8,8 11 2, 2 12 2 KEY 11 2 means 112 Mode – most common In this case 108 Mode ……
I.Q. scores of Year 10 boys 9 7, 8, 8, 9, 9 10 0,1,2,3,4,4,4,8,8,8,8 11 2, 2 12 2 KEY 11 2 means 112 Highest value – lowest value In this case: Range = 122 – 97 = 25 Range ……
I.Q. scores of Year 10 boys 9 7, 8, 8, 9, 9 10 0,1,2,3,4,4,4,8,8,8,8 11 2, 2 12 2 KEY 11 2 means 112 Put in size order (already done); then find the middle value In this case we have 19 values so we want the median = 104 Median …… 10th value
I.Q. scores of Year 10 boys 9 7, 8, 8, 9, 9 10 0,1,2,3,4,4,4,8,8,8,8 11 2, 2 12 2 KEY 11 2 means 112 Put in size order (already done); then find the value a quarter of the way up In this case we have 19 values so we want the Lower quartile = 99 Lower Quartile …… 5th value
I.Q. scores of Year 10 boys 9 7, 8, 8, 9, 9 10 0,1,2,3,4,4,4,8,8,8,8 11 2, 2 12 2 KEY 11 2 means 112 Put in size order (already done); then find the value three- quarters of the way up In this case we have 19 values so we want the Upper quartile = 108 Upper Quartile …… 15th value
Now draw a box and whisker diagram to compare the I.Q. of boys and girls you can draw this one on the same diagram as before.
90 100 110 120 130 I.Q. Score Here we go ….. What can you say about boys and girls I.Q.s ? BOYS GIRLS