Download
1 / 13
130 likes | 361 Views
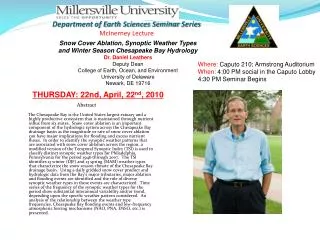
Conventional and Isentropic Analyses of a Cold-Season Heavy Rainfall Episode Associated with Elevated Convection. Dr. Scott M. Rochette Department of the Earth Sciences SUNY Brockport. 24-h Rainfall ending at 1200 UTC 14 November 1993 (in.). 0000 UTC 14 November 1993 Surface Chart

E N D
Conventional and Isentropic Analyses of a Cold-Season Heavy Rainfall Episode Associated with Elevated Convection Dr. Scott M. Rochette Department of the Earth Sciences SUNY Brockport
0000 UTC 14 November 1993 Surface Chart (standard notation/symbology)
0000 UTC 14 November 1993 850-hPa e (note strong gradient over MO)
0000 UTC 14 November 1993 850-hPa e Advection (red positive)
0000 UTC 14 November 1993 Precipitable Water (MO: 230-270% of normal)
0000 UTC 14 November 1993 KLZK e Cross-Section (note deep CI layer above shallow stable layer near surface)
0000 UTC 14 November 1993 304 K Moisture Transport Vectors (note MO downstream from MT maximum)
0000 UTC 14 November 1993 304 K Wind Vectors/Isobars/Omega (solid isentropic UVM)
0000 UTC 14 November 1993 Ageostrophic/Omega Cross-Section (Point C northwest MO; Point D south-central MO)
Cool-sector MCS cool side of sfc boundary cool side of 850-hPa e Strong LLJ coupled to ULJ? MCS in region of positive LL e advection Stable boundary layer elevated CI MCS not rooted to boundary layer High moisture content PW 230-270% of normal Diagnosis of UVM Cross-sections surfaces Isentropic MT vectors very illustrative MCS forms downstream of max MT vectors Summary