Download

1 / 27
270 likes | 359 Views
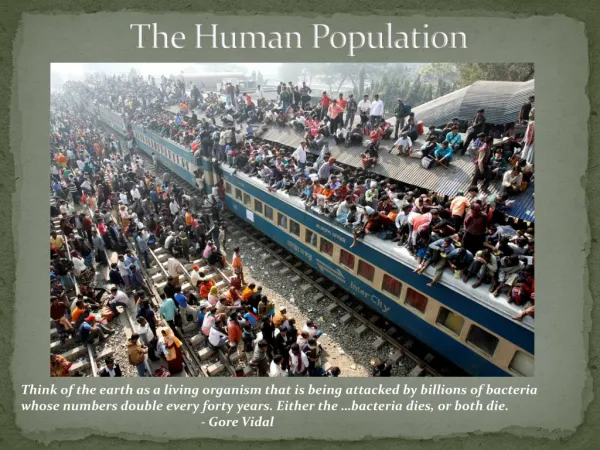
The Human Population. Chapter 7. Earth’s Carrying Capacity. Every 5 days the global human population increases by roughly 1 million lives: 1.8 million infants born - 800,000 people die What factors influence Earth’s carrying capacity for humans? Food, water, timber, fuel, disease

E N D
The Human Population Chapter 7
Earth’s Carrying Capacity • Every 5 days the global human population increases by roughly 1 million lives: • 1.8 million infants born - 800,000 people die • What factors influence Earth’s carrying capacity for humans? • Food, water, timber, fuel, disease • Advances in technology • Will humans exceed Earth’s carrying capacity? • How do we know if we have? • What should we do about it? • What are the moral, religious, and personal freedom implications?
Where are we headed? U.N. world population projection: based on women having an average of 2.5 (high), 2.0 (medium), or 1.5 (low) children
Factors that Drive Human population growth • Demography – the study of human population trends (demographer – scientists in this field) • Crude birth rate = number per 1,000 per year • Crude death rate = number per 1,000 per year • I = immigration (movement in) • E = emigration (movement out) • Global pop growth rate = CBR – CDR 10 • Nation pop growth rate = [CBR + I] – [CDR + E] 10
Some comparisons Average crude death (blue) and birth (yellow) rates for various groupings of countries in 2006
Doubling time • The number of years it takes for a population to double • Assumes that the growth rate is constant • Formula called the rule of 70 • Doubling time (in years) = 70 growth rate • Example: Population growth rate of 2% will double in 35 years: 70/2 = 35
fertility • Total fertility rate • Estimate of the average number of children for each woman during her childbearing years • Not measured per 1,000 – is a measure per woman • In 2008 in the, U.S. TFR = 2.1 • Replacement-level fertility • The TFR needed to offset the average number of deaths in a population so that the current population size remains stable • This number is typically just over 2 • This also depends on rates of pre-reproductive mortality – death before a person has children – this depends on a country’s economic status
United states birth rates in the u.s. 1910 - 2006
Factors affecting birth rates • The cost of raising and educating children • Availability of pensions • Urbanization • Education and employment opportunities • Infant deaths • Marriage age • Availability of contraception and abortion • Religious beliefs, traditions, and cultural norms
Factors affecting death rates • Death rates have declined due to: • Increased food supplies and better nutrition • Advances in medicine • Improved sanitation and personal hygiene • Safer water supplies • U.S. infant mortality is higher than it could be (ranked 46th world-wide) due to: • Inadequate pre- and post-natal care for poor • Drug addiction • High teenage birth rate
Developed vs. developing countries • Developed countries – those with relatively high levels of industrialization and income • Example: U.S. • Typically have replacement-level fertility of 2.1 • TFR = 2.1 population is stable • TFR < 2.1 population likely to decrease • TFR > 2.1 population likely to increase • Developing countries – those with relatively low levels of industrialization and incomes of < $3 per person per day • Example: India, China
Developing countries • China is the largest country – has taken drastic population control measures • By 2050 India is predicted to pass China. Pakistan is projected to become 3rd, with Iran and Ethiopia following • Russia is losing 600,000 people/year after being the 4th largest country in 1950 – due to environmental pollution, hyperinflation, crime, corruption, disease, despair
Efforts to slow population growth Governments may try these tactics: • Raising taxes • Charging other fees • Eliminating income tax deductions for a couple’s third child • Loss of health-care benefits, food allotments, job options • In China, couples who pledge to have no more than one child receive: • Extra food • Larger pensions • Better housing • Free medical care • Salary bonuses • Free school tuition for their one child • Preferential treatment in employment when their child enters the job market
china • Currently TFR = 1.6 • Has moved 300 million people out of poverty • Problems: • Strong male preference has lead to gender imbalance • Average population age is increasing • Not enough resources to support current population
India • Family planning program has basically failed due to: • Poor planning • Bureaucratic inefficiency • Low status of women • Extreme poverty • Lack of administrative financial support • Disagreement over the best ways to slow population growth
The best way to slow population growth • A combination approach works best: • Investing in family planning • Reducing poverty • Elevating the status of women – especially educational opportunities
Life expectancy • The average number of years an infant born in a particular year in a particular country can be expected to live – influenced by availability of health care, access to good nutrition, exposure to pollutants • Usually expressed in 3 ways: • Overall (2008 - U.S. 78) • Men (2008 – U.S. 75) • Women (2008 – U.S. 81) • Men usually have higher death rates: • Biological factors, greater workplace dangers, more hazardous lifestyle choices, more likely to die in wars
Infant and child mortality • Infant – deaths under age 1 per 1,000 live births • Child – deaths under age 5 per 1,000 live births • Sometimes the overall rates for a country vary widely from those for a segment of the population: • Infant mortality in U.S. = 6.6 • U.S. African Americans = 13.6 • U.S. Native Americans = 8.1 • Related to socioeconomic status and varying access to adequate nutrition and health care • An issue of environmental justice (Ch. 20)
Aging and disease • Disease is an important regulator of human population • Infectious disease are the 2nd biggest killer worldwide after heart disease • Tuberculosis and malaria have been biggest portion of this in the past • Today, HIV is #1 • HIV disproportionately infects people age 15-49 and so has a very disruptive impact on society
Age structure • Visual representation of ages within a population • Males on one side, females on the other • Each bar = 5 year age group • Three categories: • Pyramid – larger younger group; population will continue to grow due to population momentum; typical of developing countries; Venezuela, India • Column – little differences in age groups; slow or no growth rate; U.S., Australia • Inverted pyramid – larger older group; population is actually in decline; Italy, Germany, Russia
Demographic transition • Four-phase process of population and economic development as a country moves from subsistence economy to industrialization • Phase 1 – pre-modernization; slow population growth rate • High death rates offset high birth rates • Phase 2 – beginning modernization; rapid population growth rate • Death rates decline due to better sanitation and health care but birth rate remains high • Phase 3 – stable population growth • Birth rate slows • Phase 4 – declining population • More elderly than young people
Population size and consumption • Ecological footprint – the amount of resources a person uses by eating, drinking, generating waste, and consuming products • 1/5th of the human population lives in developed countries but they consume more than ½ of the world’s energy and resources • The U.S. has the largest ecological footprint of any country • IPAT equation – an estimate of impact of humans • Impact = population x affluence x technology
sustainability • Meeting the essential needs of people in the present without compromising the ability of future generations to meet their needs • Strives to improve standards of living without causing additional environmental harm • How? Some ideas: • Slower human population growth • Understanding of the connections between economic growth and environmental challenges • This is a very important APES concept! Make sure you ‘get’ it!