Download
1 / 27
270 likes | 390 Views
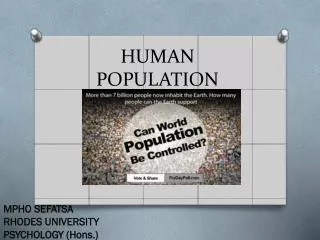
HUMAN POPULATION. Pg. 75 How does this affect Natural Disasters? ADD 1.) Consider Katrina 1,000 years ago?? 2.) Consider economic losses over time ND pg. 11 fig. 1.6 and table 1.6 NDs increasing? Cost/losses ARE increasing! WHY??? Is it, itself, a potential disaster for the future?

E N D
HUMAN POPULATION Pg. 75 How does this affect Natural Disasters? ADD 1.) Consider Katrina 1,000 years ago?? 2.) Consider economic losses over time ND pg. 11 fig. 1.6 and table 1.6 NDs increasing? Cost/losses ARE increasing! WHY??? Is it, itself, a potential disaster for the future? HOW????
HUMAN POPULATION Pg. 75 Populations grow exponentially link for general discussion a) The J-curve and more? ND pg. 16 fig. 1.11 b) Very slow growth for thousands of years - then a sharp upward shift. ADD But what about later? More complete picture c) birth rate does not have to change - death rate falls dramatically. What could cause this? Related to 1.) tools (1 million ya) 2.) agriculture (8,000 ya) and 3.) medicine (1700s)
HUMAN POPULATION Pg. 75 d) 1810 pop. 1 billion - doubled by 1925 at 2 billion (115 years). 1925-1974 doubled to 4 billion (49 years). by 2000 reached 6 billion The future?? The bigger it gets the bigger it gets FASTER. e) think of it in terms of doubling time - it will take CHANGE THIS 44 years for the world’s population to double at present growth rate of 1.6% per year. ADDDoubling Time=70DIVIDED BY (% growth rate/year)
HUMAN POPULATION Pg. 75 In general, there are TWO views on human population 1) Too many people 2) Not enough people Hmmmm - let’s investigate these viewpoints.
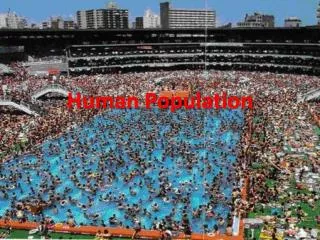
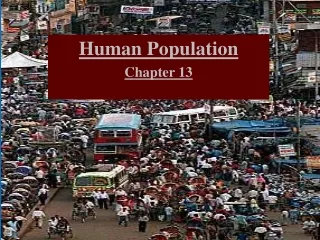
Pg. 76 1) Too Many a) The J curve points out that earth’s population will double every 50 years (or less!). With current birth/death rates b) That puts 8 billion on earth in early 2000s and 16 billion by mid to later 2000. ***The issue of too many people is: RESOURCES More people strain resources - especially as standard of living raises worldwide. What if everyone lived “high on the hog” like us? Like…CHINA?? This is termed carrying capacityin biological terms. What might happen if we exceed carrying capacity? HUMAN POPULATION
HUMAN POPULATION Pg. 76 Too many continued Resources & Facts 1) Food a.) 3/4 of a billion already suffer malnutrition largely due to unequal food distribution b.) only 11% of Earth’s surface is arable land this diminished due to…. ADD 1) erosion can’t farm the dirt if it ain’t there 2) expansion are ya going to live on it or grow on it? 3) salinization irrigation water has salts. Arid areas H2O evaps. leaves behind salts=dead crops From 1945-1990 3 billion acres (China and India combined) have been degraded.
HUMAN POPULATION Pg. 76 Too many continued Resources & Facts 2) Water a) At present 31 countries (8% world pop.) have chronic water shortages. b) Due to improper management (sewage), unequal distribution (high pop. Vs. low pop.), contamination (keeping clean and cleaning up). c) Estimates suggest by 2025 35% world pop. affected WHY?? Many of those countries cannot pay the cost for water (desalinization). Global financial inequity.
HUMAN POPULATION • Pg. 76-77 • Clean air-more people=more production=more pollution. • OK…potentially could we do things differently • Trash – More people= more trash…where to put • the piles! • 5) Deforestation-more people=more demand for • lumber/agriculture=less forest • Consider link to greenhouse effect? • Energy Resources-more people=more demand for energy • fossil fuels are being used faster than they are • being created
HUMAN POPULATION • Pg. 77 • Resources used in technology and consumer • products - including homes, hospitals, schools, etc. • (sort of a composite of the above) • Species extinctions as habitat is removed or altered • SO, what’s the problem if a few species go extinct? • Unequal distribution of resources is cited as an • issue - can that affect political stability worldwide? • Global jealousy? • Political history? • Jobs and money - will there be enough for everyone? • Sure. The question is at what level/standard of living. • **Could Earth sustain a global population ALL living • like we do?
HUMAN POPULATION Pg. 77 U.S. population is expected to peak in 2028 and then decline - So we don’t have a problem - or do we. Does the U.S. add to world population issues/concern? **A LOOK at the Economic burden on the world ecological system** 3 things dictate the economic burden 1) Population size 2) Consumption 3) Technology used to provide goods and services-medicine, transportation.
HUMAN POPULATION Pg. 78 THE U.S. IS THE LARGEST CONSUMER IN THE WORLD 3 million Americans = 90 million people from India (resources/year) a factor of 30!!! As standard of living is raised in other nations resource use per person will rise. Developed and developing nations want more STUFF Such as… coffee/tea and soda, meat, wood, fruit. POSSIBLE SCENARIO (can you think of others?) This leads to deforestation generally of rainforest. POSITIVE FEEDBACK (positive???) Poor soils - land used up in short time - new areas turned to crop land-poor soils-land used up…..
HUMAN POPULATION Pg. 78 ONE RESULT Poor nations trade products for money. Is that a DEAL? NO- Consumers do not pay for the environmental damage to the ecosystems. Sustainability - consumers need to use less and pay more. WHY???
HUMAN POPULATION • Pg. 78 • THE SECOND IDEA OF HUMAN POPULATION IS THAT • THERE ARE TOO FEW PEOPLE. • TOO FEW PEOPLE • Information provided by the Population Research Institute • 1) This group believes the population in NOT expanding as • fast as predicted. • 2) They cite shrinking family size. • Census Bureau world fertility rate is 2.9 children per • woman. This is lowest level ever. In 1985 it was 4.9. • Mmmm…? • Developed nations have lowest fertility rate. Europe • especially low at 1.3 children per woman. • Germany and Japan offer financial incentives for more • children.
HUMAN POPULATION ADD Another way to look at it. If you calculate a.) 6 billion people (todays pop.) b.) Each get 3 x1 foot space c.) the entire world population fits in 26mi2? So the world is mostly uninhabited. Right? AGREE DISAGREE STRONGLY DISAGREE STRONGLY AGREE
HUMAN POPULATION Pg. 79 WHY?? Economies based on growth. Countries with low growth rates fear: a) labor shortages reducing production of goods b) housing market will stagnate/real estate sales slow c) above affect whole economy
HUMAN POPULATION • Pg. 79 • Believe world population will peak at 2030 and then • continually decline. But…. • ADD POPULATION DENSITY RELATED ISSUES • A) Intraspecies Competition: members of the same species • compete for resources • reindeer example and gypsy moth example • Food resource issue • B) Interspecies Competition: two species compete for • resources • Paramecia species cultivation (alone vs. together) • better competitior? • Which better represents concerns for human populations? • WHY?
HUMAN POPULATION Pg. 79 Another Issue - Population “control” can lead to loss of freedom - genocide in some cases. a) freedom to choose family size example: China b) enforced sterilization of specific groups example: Peru (target is poor rural women which generally are Native Indians) POINT: Opens the door to ethically/morally “dicey” policy?
HUMAN POPULATION CASE HISTORY Rapa Nui (Easter Island) Volcanic island west of Chile Not the greatest to begin with high temp and humidty no permanent rivers poorly drained, marginal soils Early 5th century seafaring Polynesians settled here. Brought with them 1) chickens 2) rats 3) food plants (only yams could survive harsh climate) Source: http://www.unmuseum.org/easteri.htm
HUMAN POPULATION CASE HISTORY Rapa Nui (Easter Island) Developed a complex social system Customs include competitions building huge statues (moai) up to 20 ft. high Pop. peaked at about 7,000, moai 600 with about 300 more being built in quarries. Civilization began to decline rapidly and savagely Source: http://www.unmuseum.org/easteri.htm
HUMAN POPULATION CASE HISTORY Rapa Nui (Easter Island) Easter Sunday, 5 April 1722 first European contact, Dutch Found 2,000 people living in caves in a primitive state These remnants were engaged in nearly constant warfare Practicing cannibalism WHAT HAPPENED???? Source: http://www.unmuseum.org/easteri.htm
HUMAN POPULATION • CASE HISTORY • Rapa Nui (Easter Island) • Transporting the moai used up trees and resources. • With no trees… • Soil erosion increased and farming became more difficult • b) Homes could not be built • c) No fuel • d) No transportation (canoes) to leave or to use for fishing. • RESULTS: statue based religion disintegrated, clans • were reduced to warfare and cannibalism to survive • HOW IS THIS LIKE EARTH?
HUMAN POPULATION QUIZ 1.) Which of the following best describes how populations increase exponentially? + + B A POP. POP. - - - TIME + - TIME + + C POP. - - TIME +
QUIZ HUMAN POPULATION 2.) Which part of the curve represents carrying capacity? C B A
HUMAN POPULATION QUIZ • 3.) What evidence is used to support the view that there • are not enough people on the planet? • a) exponential growth • b) that the current population only takes up about 26 mi2 • c) first part of human history saw little population growth • d) family size is increasing • 4.) What evidence is NOT used to support the view that • there are too many people? • Shrinking family size • b) Only 11% of the Earth’s surface is arable (farmable) • c) Resources are also part of the equation • d) There already exists a significant water shortage
HUMAN POPULATION QUIZ • 5.) Which BEST describes what the Reindeer case history • implies might happen to human populations? • Populations reach carrying capacity and then crash • b) Populations reach carrying capacity and then increase • c) Populations reach carrying capacity and then fluctuate • d) Populations reach carrying capacity and then remain • constant • 6) The people/island/moai/Dutch in the Rapa Nui • (Easter Island) case history each represent what?
HUMAN POPULATION QUIZ • 7.) The idea of sustainability suggests that consumers • should pay… • a) More to fix increasing environmental problems caused by • production • b) The same to fix the constant environmental problems • caused by production • c) Less to fix the decreasing environmental problems caused • by production
HUMAN POPULATION QUIZ • 8.) In the graph below what could best explain the portion • labeled C? • Increase in fertility • b) Decreae in mortality • c) Introduction of predator species • d) disease