Download
1 / 18
260 likes | 459 Views
Land surface temperature (LST) and its applications. Darren Ghent, John Remedios Earth Observation Science Department of Physics and Astronomy University of Leicester. Outline. Background LST improvements LST validation LST applications Outputs Next 12-months Phase-2. Background.

E N D
Land surface temperature (LST) and its applications Darren Ghent, John Remedios Earth Observation Science Department of Physics and Astronomy University of Leicester NCEO Land Science
Outline • Background • LST improvements • LST validation • LST applications • Outputs • Next 12-months • Phase-2 NCEO Land Science
Background What is land surface temperature (LST)? • LST is the radiative skin temperature (~20μm) of the land • It is an important climate variable derived from solar radiation and is influenced by land/atmosphere boundary conditions • It determines the emission of surface-to-atmosphere long-wave radiation • It exerts control over the partitioning of energy into latent and sensible heat fluxes, and heat flux into the ground • It influences land/atmosphere coupling – water and carbon cycling • It can be retrieved from microwave and IR sensors • Although microwaves are able to penetrate clouds the signal originating from Earth is stronger at IR wavelengths • Several issues with off-the-shelf LST products NCEO Land Science
Background Consultation with users from several scientific fields which utilise LST data, both across Europe and the US elicited the following recommendations • Availability – • Provision of level-3 gridded data at a variety of resolutions (0.5°, 1.0° for example) • Commonly used file formats are important to ensure maximum exploitation of LST products • The processing of long time-series of LST • Accuracy – • Improved cloud screening algorithms • Provision of uncertainty estimates • Multiple observation angles to improve atmospheric correction • Validation – • Longer validation studies over a variety of surface regimes • An increased emphasis on radiance-based validation • An increase in the number of intercomparison studies • Resolution – • A better resolution of the LST diurnal cycle • Higher resolution products for resolving agricultural fields and urban features for example • Combined LST products from instruments on Low Earth Orbit (LEO) satellites and geostationary satellites Phase-1 Phase-1 + Phase-2 Phase-2 Phase-1 + Phase-2 NCEO Land Science
Improving auxiliary datasets Operational AATSR LST (right) using operational biome (left) and fractional vegetation data (centre) UoL AATSR LST (right) using Globcover biome (left) and CYCLOPES fractional vegetation data (centre) NCEO Land Science
Improving cloud masking Improved cloud mask Operational cloud mask NCEO Land Science
Improving snow masking RGB image (1st column); operational snow masking – orange (2nd column); operational cloud masking – green (3rd column); updated snow masking using a Bayesian approach - Water,Sea Ice ,Land Ice , SeaCloud ,Land Cloud ,Clear Land (4th column) over Ostrov Sakhalin, Russia, Jan 2006. NCEO Land Science
Assessment of data quality Methodologies:Temperature-based; Radiance-based; Intercomparison Temperature-based • Temperature method represents the conventional method for satellite LST validation. It involves the direct comparison of concurrent ground measurements acquired at a field site with LST acquired from the satellite overpass. • Creation of matchup database (MDB) Radiance-based • Radiance method consists of calculating the ground LST from (TOA) brightness temperatures simulated using surface emissivity and temperature data plus atmospheric profile data in a radiative transfer model. • For each instrument top-of-atmosphere brightness temperatures (BTs) are simulated for the 11 and 12 μm channels using the fast radiative transfer model RTTOV-10. • Utilised the ECMWF ERA-Interim profiles and 11 and 12 μm channel emissivities derived from CIMSS emissivity database (Seemann et al., 2008). Satellite-retrieved LST is taken as the input skin temperature to the model. • Perturbations applied to the input skin temperature until the simulated BTs match the satellite retrieved BTs. • LST error is the difference between satellite-retrieved LST and inverted skin temperature. • Quality of the atmospheric profiles assessed through the difference Δ(T11–T12) between the satellite-retrieved BT differences (T11–T12) and the simulated BT differences (T11–T12). NCEO Land Science
Temperature-based validation Temperature-based validation at Gobabeb, Namibia, 2009: AATSR (1st column), Terra-MODIS (2nd column), Aqua-MODIS (3rd column), SEVIRI (4th column) NCEO Land Science
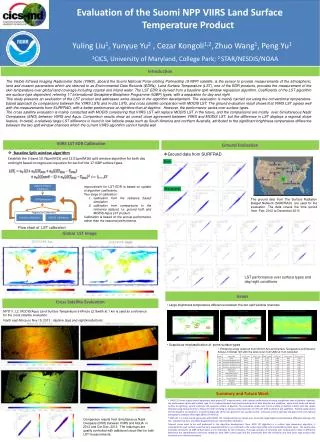
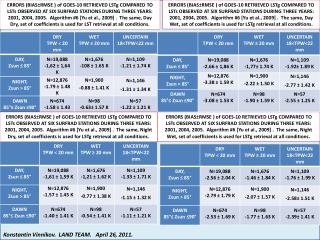
Radiance-based validation • Surface emissivities are taken from CIMSS dataset, which is derived from MODIS. Probable reason for larger absolute uncertainty in AATSR data. • Δ(T11–T12) should be close to zero when the atmospheric temperature and water vapour profiles used in simulations represent the real atmospheric conditions and effect of the surface emissivities for the satellite observations. Only accurate profile associations (-1.0K < Δ(T11–T12) < 1.0K) were considered. • Mean ΔLSTs are 0.63 K (AATSR), -0.3 K (Terra-MODIS) and -0.2 K (Aqua-MODIS). Radiance-based LST Errors for the AATSR updated LST algorithm (left), Terra-MODIS (centre), Aqua-MODIS (right). LST errors derived for each month of 2006. NCEO Land Science
LST intercomparison Comparison of mean daytime LST composites for 2006: March (1st row), June (2nd row), September (3rd row), December (4th row); SEVIRI absolute LST (1st column); AATSR minus SEVIRI (2nd column); JULES minus SEVIRI (3rd column); Terra-MODIS minus SEVIRI (4th column) NCEO Land Science
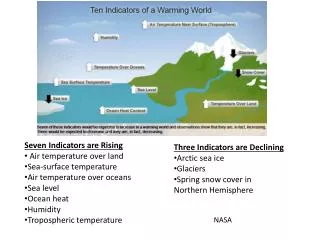
LST applications • Climate change: Urban heat, land/atm. coupling, surface energy balance, carbon cycle • Modelling studies: Model validation, data assimilation • Land cover change: Desertification, change detection • Crop management: Irrigation, drought stress • Water management: Evapotranspiration, soil moisture retrievals • Fire monitoring: Burned area mapping, fuel moisture content • Geological applications: Geothermal anomalies, volcanic activity NCEO Land Science
LST and hydrology • Surface energy balance models can estimate evapotranspiration (ET) from this partitioning of energy available at the land surface • LST retrieval can be a valuable metric in the estimation of ET and soil water without the need for additional data such as precipitation or soil texture, since varying soil moisture conditions yield distinctive soil and canopy thermal signatures • 0.5K LST error can result in a 10% error in sensible heat flux (Brutsaert et al., 1993) • 1.0K LST error can lead to a 10% error in ET (Moran and Jackson, 1991) • LST Errors between 1.0K and 3.0K can lead to errors as much as 100Wm-2 in heat fluxes (Kustas and Norman, 1996) A decrease in the Tmax lag occurs as soil moisture decreases. There is a general increase in the LST diurnal cycle as soil moisture decreases. EO and JULES LST vs. in situ LST (left); in situ LST vs. in situ soil moisture (centre) - KNP, South Africa AATSR LST anomaly for April 2011 with respect to 2003-2011 climatology NCEO Land Science
LST and data assimilation • Not only can LST act as a proxy for soil water it can constrain the simulation of soil water in models through data assimilation (DA) • Assimilation of LST observations into land surface models has been shown to constrain soil moisture (below-left) and ET (below-right) (Ghent et al., 2010; 2011) • Other examples of DA include: • Assimilation of MSG LST into JULES over the Sahel (Phil Harris, CEH) providing mesoscale structure critical for storm initiation • Using adJULES with LST data to constrain parameters related to root zone soil moisture (SWELTER-21 Changing Water Cycle project - CEH/Met Office/Leicester/Reading) NCEO Land Science
Outputs AATSR Level-3 product (left) at user-defined spatial resolution Daytime July 2007 at 0.05° AATSR LST data portal (below) Publications: Ghent et al. (2010) Assimilation of land-surface temperature into the land surface model JULES with an Ensemble Kalman Filter, JGR, 115, D19112 Ghent et al. (2011) Data assimilation into land-surface models: the implications for climate feedbacks, IJRS, 32, 617-632 Ghent and Remedios. Land surface temperature evaluation in a mixed tree/grass landscape (submitted to RSE) Ghent et al. Improving the AATSR land surface temperature retrieval with higher resolution auxiliary datasets (in preparation) Ghent et al. Radiance-based validation of land surface temperature from AATRS, MODIS and SEVIRI (in preparation) NCEO Land Science
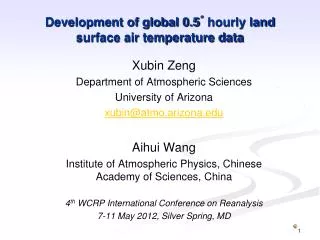
Next 12-months • To examine the LST long-term time series in comparison to the global, in situ, land surface air temperature series for climate. • LST long-time series vs. land surface conditions (soil temperature, soil moisture) with respect to biome and vegetation cover. • Provide error uncertainties and quality controlled land surface temperature data for assimilation into JULES. NCEO Land Science
Phase-2 • Climate quality, multi-dimensional LST time series from current and future missions (SLSTR, MSG-3/4, NPP) • Significant algorithm improvements, with consistent application to current and future sensors for LST time series (dual-view angular dependences, snow and ice). Continue improvements into cloud and snow/ice masking • First comprehensive validation matchup database for LST data quality; comparisons to air temperature (for climate) and soil temperature (for JULES verification) • Combined geostationary satellites (SEVIRI, GOES, MTSAT) and polar-orbiters (AATSR, MODIS, AVHRR) to give near-global, diurnal, climate quality LST. • LST overlap analysis between current missions and planned missions, and algorithm support for future missions: AATSR and SLSTR (MODIS and VIIRS on NPP); SEVIRI on MSG-2 and MSG-3/4 NCEO Land Science
Phase-2 • Optimise LST for JULES model verification and assimilation of LST: • Global gridded product at different spatial resolutions for model validation / assimilation into JULES • Support JULES assimilation of LST • Investigate the Canopy Heat Capacity model in JULES for fully vegetated surfaces with respect to LST from satellite • Global estimates of drought stress and simulation of evapotranspiration. • Calculate soil heat fluxes from LST and verify with JULES • Derive soil moisture from a combination of soil temperature and LST • LST in the urban environment: • Estimation of sub-pixel LST in urban environments using for example empirical relationships for land-cover classes • Investigate relationships between diurnal LST anomalies and heat waves • Time series of urban LST vs. rural LST. • This work will put NCEO at the centre of the Sentinel-3 scientific data processing (and potentially that for MSG). NCEO Land Science