Download
1 / 12
120 likes | 367 Views
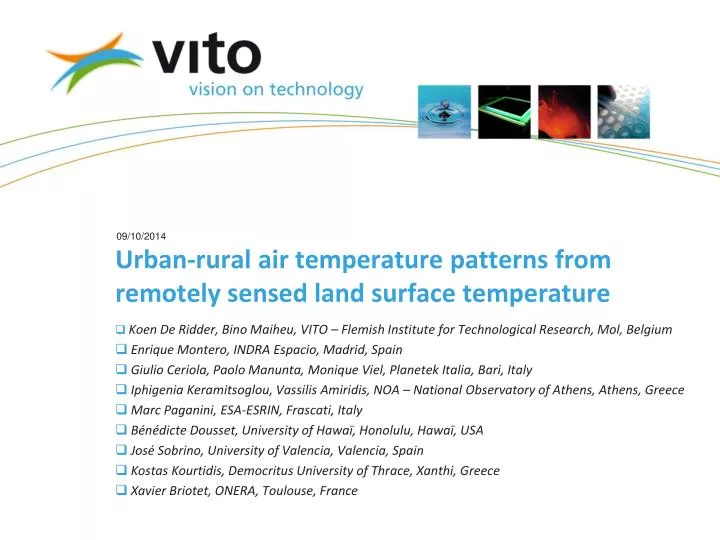
Urban-rural air temperature patterns from remotely sensed land surface temperature. Koen De Ridder, Bino Maiheu, VITO – Flemish Institute for Technological Research, Mol, Belgium Enrique Montero, INDRA Espacio, Madrid, Spain

E N D
Urban-rural air temperature patterns from remotely sensed land surface temperature Koen De Ridder, Bino Maiheu, VITO – Flemish Institute for Technological Research, Mol, Belgium Enrique Montero, INDRA Espacio, Madrid, Spain Giulio Ceriola, Paolo Manunta, Monique Viel, Planetek Italia, Bari, Italy Iphigenia Keramitsoglou, Vassilis Amiridis, NOA – National Observatory of Athens, Athens, Greece Marc Paganini, ESA-ESRIN, Frascati, Italy Bénédicte Dousset, University of Hawaï, Honolulu, Hawaï, USA José Sobrino, University of Valencia, Valencia, Spain Kostas Kourtidis, Democritus University of Thrace, Xanthi, Greece Xavier Briotet, ONERA, Toulouse, France
urban heat island phenomenon – impacts health energyconsumption • “The evidence that heat waves can result in both increased deaths and illness is substantial, and concern over this issue is rising because of climate change” Reid CE, O’Neill MS, Gronlund CJ, Brines SJ, Brown DG, Diez-Roux AV, et al. 2009. Mapping Community Determinants of Heat Vulnerability. Environ Health Perspect117:1730-1736. Sailor, D. J. 2002. Urban Heat Islands, Opportunities and Challenges for Mitigation and Adaptation. Sample Electric Load Data for New Orleans, LA (NOPSI, 1995). North American Urban Heat Island Summit. Toronto, Canada. 1–4 May 2002. Data courtesy Entergy Corporation.
ESA-UHI project – objectives • demonstrate use of thermal infrared (TIR) satellite imagery to map urban heat island characteristics for ten European cities and using different sensors (SEVIRI, AVHRR, ASTER, …) • thermal remote sensing alone is not sufficient to describe the urban heat island need to determine air temperature from land surface temperature imagery • this presentation focuses on • retrieval of air temperature from ASTER TIR imagery • case study for the Madrid area
ASTER – Advanced Spaceborne Thermal Emission and Reflection Radiometer • onboard Terra platform • channels: • visible / near infrared • short-wave infared • thermal infrared • five thermal channels • range 8.125 – 11.65 µm • spatial resolution 90 m
land surface temperature derived from ASTERMadrid area, 25 June 2008, 22:18 UTatmospheric and surface emissivity corrections
method (1) • calculate turbulent sensible heat flux H from • verticaltemperaturegradientTs-Ta • aerodynamicresistancerah • useH as lowerboundarycondition in a numericaladvection-diffusion model, forcedby ECMWF large-scaleforcing • update air temperatureTausingthis model • back to step 1. background air temperature
method (2) • ASTER pixels are characterized by a single temperature only while they are composed of a mixture of land cover types (vegetation, soil, urban, …) • this requires the specification of aggregated values for • momentum roughness length z0 ( Mason, 1988) • thermal roughness length z0t ( Beljaars and Holtslag, 1991) • specification of kB-1[ ln(z0/z0t)] • kB-1 = 2 over vegetation • over cities Zilitinkevich (1970)
validation ASTER 25 June 2008 11:13 UT ASTER 25 June 2008 22:18 UT
day versus night air temperature % sealed soil surfaces 2-m air temperature 25 June 2008 11:13 UT 2-m air temperature 25 June 2008 22:18 UT
conclusions • we implemented • an aerodynamic method to obtain sensible heat flux from satellite surface temperature, • coupled to a coarse atmospheric model to estimate background air temperature • validation for Madrid for a day/night image pair yielded • average errors of the order of 1°C • pattern correlation coefficients 0.8 • it was found that • the UHI is stronger at night than during the day • cooling effect Retiro park 0.5-1.5 °C (background temperature!)