Download
1 / 43
430 likes | 441 Views
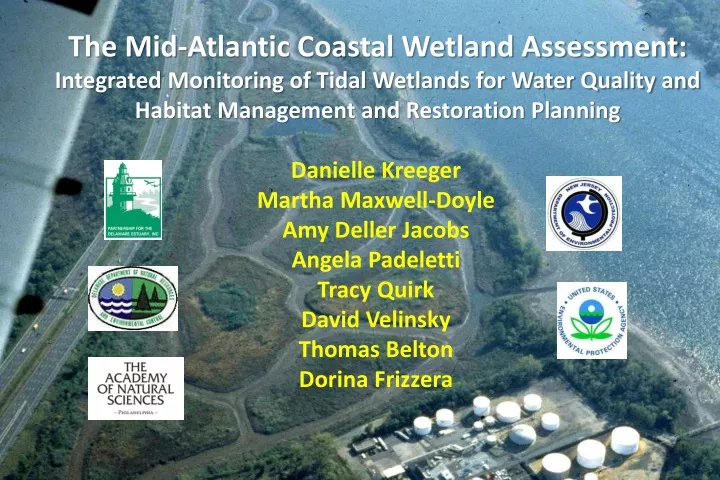
The Mid-Atlantic Coastal Wetland Assessment: Integrated Monitoring of Tidal Wetlands for Water Quality and Habitat Management and Restoration Planning. Danielle Kreeger Martha Maxwell-Doyle Amy Deller Jacobs Angela Padeletti Tracy Quirk David Velinsky Thomas Belton Dorina Frizzera.

E N D
The Mid-Atlantic Coastal Wetland Assessment: Integrated Monitoring of Tidal Wetlands for Water Quality and Habitat Management and Restoration Planning Danielle Kreeger Martha Maxwell-Doyle Amy Deller Jacobs Angela Padeletti Tracy Quirk David Velinsky Thomas Belton Dorina Frizzera
Tidal Wetlands A Signature Trait of System Near Contiguous Band Diverse: Freshwater Tidal Marshes Brackish Marshes Salt Marshes Nature’s Benefits Flood Protection Fish and Wildlife Natural Areas Carbon Sequestration Water Quality
State of the Estuary Report 2008 Acreage? no recent, consistent, high resolution data across the estuary Condition? no data
Tidal Wetland Projections - IEc 2100 2000 • SLAMM V.6 Findings: • 26% loss of 42,558 hectares of tidal wetlands • loss of 50,236 hectares of adjacent uplands and non-tidal wetlands • gain of 106,529 hectares of open water and tidal flats • net loss of >60,000 metric tons/year of primary production services
Will Tidal Wetlands Keep Pace with SLR? Sediment Supply Energy, Erosion Primary Productivity Elevation Capitol Sea Level Nutrients
Angola Neck – Rehoboth Bay, DE Summer, 2006 Sudden Wetland Dieback – Marsh Browning Slide from Chris Bason and Amy Jacobs
Tidal Wetlands - NEP Priority State of Estuary Reporting Regulatory Decision-Making On-the-Ground Projects Water Quality Management Fish and Wildlife Management MACWA Climate Adaptation Restoration Planning
Water Quality - Wetland Interactions • Alter Vegetation Types • Impair Condition • Affect Accretion • Enhance Vulnerability • Sinks for Sediments • Sinks for Nutrients • Detoxify Some Contaminants • Sinks for Pathogens ? Will nutrient criteria need to be more stringent if >25% tidal wetlands are lost?
Mid-Atlantic Coastal Wetland Assessment (MACWA) Delaware Estuary Wetland Monitoring & Assessment Program (DEWMAP) Freshwater Tidal Marsh Salt Marsh
Acknowledgements Mid-Atlantic Coastal Wetland Assessment (MACWA) • Sample Frame all tidal wetlands between coastal New Jersey and coastal Maryland, including the Delaware Estuary • Subpopulations wetland type (oligohaline, mesohaline, polyhaline) state (DE, NJ, PA) estuary (NEPs and vicinity)
Guidance from EPA Intensive monitoring at fixed stations Level IV
MACWA Design: Tier 1 data on acreage, some condition Tier 2 data on condition, stressors Tiers 3 and 4 data on condition, function, stressors
Tier 1 Example Percentage Loss of Emergent Tidal Marsh 1996-2006
Tier 1 Satellite Data – Kearney and Riter 1993 Percent vegetation 2006
MACWA Current Focus Tier 2 Rapid Assessment Methods (RAM) Tier 4 Site-Specific Intensive Monitoring (SSIM)
Delaware Estuary Barnegat Bay DE Inland Bays MD Coastal Bays Others? Other NJ Coastal MACWA
STAC Wetland Work Group MACWAG • Focus on Tidal Marshes • Link to Adjacent Estuaries (Network) National Wetland Monitoring & Assessment Work Group NWMAWG Mid-Atlantic Wetland Work Group MAWWG
MACWA Sites in the Delaware Estuary See later slide for updated fixed station locations
Main Points of Contact RAM SSIM Angela Padeletti (PDE) Tracy Quirk (ANSP) See her poster!
RAM DE MidTRAM (Jacobs et al.)3 Attributes: • Buffer Integrity • Hydrologic Integrity • Habitat/Bio Integrity
RAM Progress • MidTRAM Training • QAPP • Tests Near SSIM Stations • All Tidal Wetlands in PA • Broadkill Watershed, DE 2011: • Maurice Watershed, NJ • Christina Watershed, DE 2012: • Barnegat Bay, NJ
Tidal Wetlands – Condition Comparison Analysis by Alison Rogerson, DNREC
RAM Lessons Learned 2010A large portion of tidal freshwater wetlands in PA were degraded in condition. But condition scores were comparable to salt marshes in the St. Jones and Broadkill watersheds of DESome stressors found in the upper estuary, such as trash smothering were not directly captured by MidTRAMMidTRAM modifications are being considered based on these lessons and to potentially add shoreline condition (erosion, alterations)
Future RAM Strategy(contingent on funding)Delaware Estuary2009 – 2015+Barnegat Bay 2012+Delaware Inland Bayscompleted
Main Points of Contact RAM SSIM Angela Padeletti (PDE) Tracy Quirk (ANSP) See her poster!
SSSIM Efforts • Site Selection • QAPP • Coordination - ANSP on phys/chem - NEPs on bio • 2010 - Baseline monitoring - SETs Installed • 2011: Site Expansion - Water Quality - SET Readings, Biological
Tier 4 Example Metrics Water Quality Elevation and Sediment Budget Biogeochemical Cycling Plant Community Integrity Carbon Storage Functional Dominant Fauna Integrity Tier 4 Example Stations
MACWA SSIM StationsDelaware Estuary Tidal Wetlands Non-Tidal Wetlands SSIM Stations (Priority) SSIM Stations (Secondary) SSIM Stations (Pending) Villanova Stations DNREC Stations
MACWA SSIM StationsBarnegat Bay High Salt Marsh Low Salt Marsh SSIM Stations
One size fits all? • No: include both “Core” and “Supplemental” metrics for both RAM and station monitoring • Compare only core metrics for climate and other • sub-regional monitoring needs • Use core + supplemental metrics for local or • watershed specific needs MACWA
MACWA Partners (so far) Academy of Natural Sciences Barnegat Bay Estuary Program DNREC EPA HQ, Regions2 and 3 NJDEP + NJ Coast Zone Program PADEP PDE (Coordinator) Rutgers University Villanova University Wetland Associates
Summary • Coastal wetlands are a hallmark feature of the Delaware Estuary and coastal mid-Atlantic • They provide diverse critical goods and services that sustain lives and livelihoods • They are extremely vulnerable to combined watershed and climate stressors • Improved efforts to monitor wetland status and trends will assist in managing and sustaining them into the future • Regional coordination strengthens scientific outcomes, improves management and leverages more diverse funding
We Thank the Many People Who Have Assisted in Workshops, Workgroups and in the Field And We Are Grateful to Our Funders: EPA Headquarters EPA Region 2 EPA National Estuary Program DE Dept. of Natural Resources Environ. Control NJ Coastal Management Program PA Coastal Management Program
Wetland Benefits (Ecosystem Services) Livelihoods Health Health Lives Health Health Health