Download
1 / 43
470 likes | 497 Views
Chapter 14. Business vs. Financial Risk Optimal Capital Structure Operating Leverage Capital Structure Theory. Capital Structure and Leverage. What is business risk?. Uncertainty about future operating income (EBIT), i.e., how well can we predict operating income?

E N D
Chapter 14 • Business vs. Financial Risk • Optimal Capital Structure • Operating Leverage • Capital Structure Theory Capital Structure and Leverage
What is business risk? • Uncertainty about future operating income (EBIT), i.e., how well can we predict operating income? • Note that business risk does not include financing effects. Low risk Probability High risk 0 E(EBIT) EBIT
What determines business risk? • Uncertainty about demand (sales) • Uncertainty about output prices • Uncertainty about costs • Product, other types of liability • Operating leverage
What is operating leverage, and how does it affect a firm’s business risk? • Operating leverage is the use of fixed costs rather than variable costs. • If most costs are fixed, hence do not decline when demand falls, then the firm has high operating leverage.
Rev. Rev. $ $ } TC Profit TC FC FC QBE QBE Sales Sales Effect of Operating Leverage • More operating leverage leads to more business risk, for then a small sales decline causes a big profit decline. • What happens if variable costs change?
Using Operating Leverage • Typical situation: Can use operating leverage to get higher E(EBIT), but risk also increases. Low operating leverage Probability High operating leverage EBITL EBITH
What is financial leverage?Financial risk? • Financial leverage is the use of debt and preferred stock. • Financial risk is the additional risk concentrated on common stockholders as a result of financial leverage.
Business Risk vs. Financial Risk • Business risk depends on business factors such as competition, product liability, and operating leverage. • Financial risk depends only on the types of securities issued. • More debt, more financial risk. • Concentrates business risk on stockholders.
An Example:Illustrating Effects of Financial Leverage • Two firms with the same operating leverage, business risk, and probability distribution of EBIT. • Only differ with respect to their use of debt (capital structure).
The Effect of Leverage on Profitability and Debt Coverage • For leverage to raise expected ROE, must have BEP > rd. • Why? If rd > BEP, then the interest expense will be higher than the operating income produced by debt-financed assets, so leverage will depress income. • As debt increases, TIE decreases because EBIT is unaffected by debt, but interest expense increases (Int Exp = rdD).
Conclusions • Basic earning power (BEP) is unaffected by financial leverage. • L has higher expected ROE because BEP > rd. • L has much wider ROE (and EPS) swings because of fixed interest charges. Its higher expected return is accompanied by higher risk.
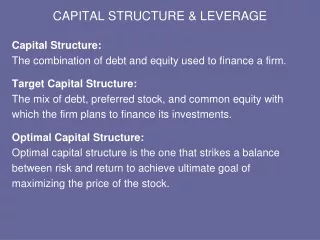
Optimal Capital Structure • The capital structure (mix of debt, preferred, and common equity) at which P0 is maximized. • Trades off higher E(ROE) and EPS against higher risk. The tax-related benefits of leverage are exactly offset by the debt’s risk-related costs. • The target capital structure is the mix of debt, preferred stock, and common equity with which the firm intends to raise capital.
Sequence of Events in a Recapitalization • Firm announces the recapitalization. • New debt is issued. • Proceeds are used to repurchasestock. • The number of shares repurchased is equal to the amount of debt issued divided by price per share.
Why do the bond rating and cost of debt depend upon the amount of debt borrowed? • As the firm borrows more money, the firm increases its financial risk causing the firm’s bond rating to decrease, and its cost of debt to increase.
Analyze the recapitalization at various debt levels and determine the EPS and TIE at each level.
Determining EPS and TIE at Different Levels of Debt (D = $250,000 and rd = 8%)
Determining EPS and TIE at Different Levels of Debt (D = $500,000 and rd = 9%)
Determining EPS and TIE at Different Levels of Debt (D = $750,000 and rd = 11.5%)
Determining EPS and TIE at Different Levels of Debt (D = $1,000,000 and rd = 14%)
If all earnings are paid out as dividends, E(g) = 0. EPS = DPS. To find the expected stock price ( ), we must find the appropriate rs at each of the debt levels discussed. Stock Price with Zero Growth
What effect does more debt have on a firm’s cost of equity? • If the level of debt increases, the firm’s risk increases. • We have already observed the increase in the cost of debt. • However, the risk of the firm’s equity also increases, resulting in a higher rs.
The Hamada Equation • Because the increased use of debt causes both the costs of debt and equity to increase, we need to estimate the new cost of equity. • The Hamada equation attempts to quantify the increased cost of equity due to financial leverage. • Uses the firm’s unlevered beta, which represents the firm’s business risk as if it had no debt.
The Hamada Equation bL= bU[1 + (1 – T)(D/E)] • Suppose, the risk-free rate is 6%, as is the market risk premium. The unlevered beta of the firm is 1.0. We were previously told that total assets were $2,000,000.
Calculating Levered Betas and Costs of Equity If D = $250, bL = 1.0[1 + (0.6)($250/$1,750)] = 1.0857 rs = rRF + (rM – rRF)bL = 6.0% + (6.0%)1.0857 = 12.51%
Finding Optimal Capital Structure • The firm’s optimal capital structure can be determined two ways: • Minimizes WACC. • Maximizes stock price. • Both methods yield the same results.
What debt ratio maximizes EPS? • Maximum EPS = $3.90 at D = $1,000,000, and D/A = 50%. (Remember DPS = EPS because payout = 100%.) • Risk is too high at D/A = 50%.
What is Campus Deli’s optimal capital structure? • P0 is maximized ($26.89) at D/A = $500,000/$2,000,000 = 25%, so optimal D/A = 25%. • EPS is maximized at 50%, but primary interest is stock price, not E(EPS). • The example shows that we can push up E(EPS) by using more debt, but the risk resulting from increased leverage more than offsets the benefit of higher E(EPS).
What if there were more/less business risk than originally estimated, how would the analysis be affected? • If there were higher business risk, then the probability of financial distress would be greater at any debt level, and the optimal capital structure would be one that had less debt. • However, lower business risk would lead to an optimal capital structure with more debt.
How would these factors affect the target capital structure? • Sales stability? • High operating leverage? • Increase in the corporate tax rate? • Increase in the personal tax rate? • Increase in bankruptcy costs? • Management spending lots of money on lavish perks?
Modigliani-Miller Irrelevance Theory Value of Stock MM result Actual No leverage D/A 0 D1 D2
Modigliani-Miller Irrelevance Theory • The graph shows MM’s tax benefit vs. bankruptcy cost theory. • Logical, but doesn’t tell whole capital structure story. Main problem--assumes investors have same information as managers.
Incorporating Signaling Effects • Signaling theory suggests firms should use less debt than MM suggest. • This unused debt capacity helps avoid stock sales, which depress stock price because of signaling effects.
What are “signaling” effects in capital structure? • Assumptions: • Managers have better information about a firm’s long-run value than outside investors. • Managers act in the best interests of current stockholders. • What can managers be expected to do? • Issue stock if they think stock is overvalued. • Issue debt if they think stock is undervalued. • As a result, investors view a stock offering negatively─managers think stock is overvalued.
What can managers be expected to do? • Issue stock if they think stock is overvalued. • Issue debt if they think stock is undervalued. • As a result, investors view a common stock offering as a negative signal─managers think stock is overvalued.
Conclusions on Capital Structure • Need to make calculations as we did, but should also recognize inputs are “guesstimates.” • As a result of imprecise numbers, capital structure decisions have a large judgmental content. • We end up with capital structures varying widely among firms, even similar ones in same industry.