Download
1 / 26
260 likes | 264 Views
Learn about capital structure and leverage, including optimal capital structure, factors influencing capital structure decisions, business risk, financial risk, and different types of leverage.

E N D
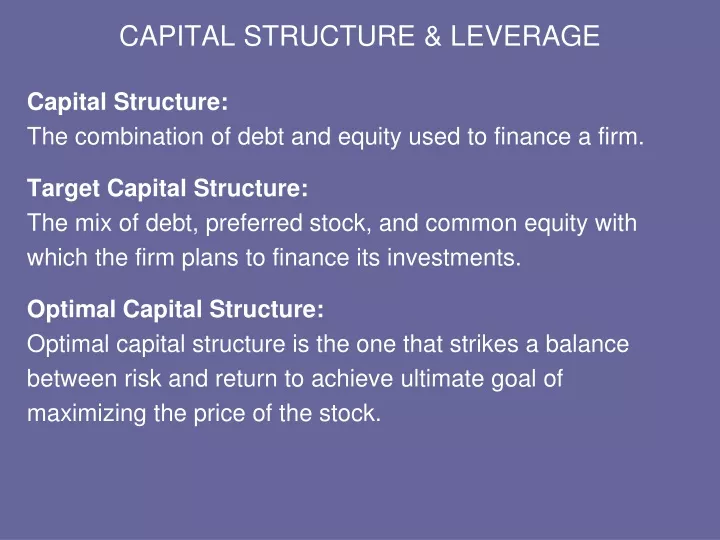
CAPITAL STRUCTURE & LEVERAGE Capital Structure: The combination of debt and equity used to finance a firm. Target Capital Structure: The mix of debt, preferred stock, and common equity with which the firm plans to finance its investments. Optimal Capital Structure: Optimal capital structure is the one that strikes a balance between risk and return to achieve ultimate goal of maximizing the price of the stock.
Capital structure policy involves a trade-off between risk and return. • Using more debt raises the riskiness of the firm’s earnings stream, but a higher proportion of debt generally leads to a higher expected rate of return. • Higher risk associated with greater debt tends to lower the firm’s stock price. • At the same time, however, the higher expected rate of return makes the stock more attractive to investors, which, in turn, ultimately increases the stock’s price.
Four primary factors influences capital structure decisions- • Business Risk: the riskiness that would be inherent in the firm’s operations if it used no debt. The greater the firm’s business risk, the lower the amount of debt that is optimal. • Tax Position: a major reasons for using debt is that interest is tax deductible, which lowers the effective cost of debt. • Financial Flexibility: the ability to raise capital on reasonable terms under adverse conditions. • Managerial Attitude: conservatism or aggressiveness with regard to borrowing. Some managers are more aggressive than others, hence, some firms are more inclined to use debt in an effort to boost profits.
Business Risk: The risk associated with projections of a firm’s future returns, either on assets (ROA) or on equity (ROE), if the firm uses no debt, or debt like financing (i.e. preferred stock). It is the risk associated with the firm’s operations, ignoring any financial effects. Financial Risk: The additional risk, over and above the basic business risk, placed on common stockholders that results from using financing alternatives with fixed periodic payments, such as debt and preferred stock. It is the risk associated with using debt or preferred stock.
LEVERAGE Leverage: Leverage results from the use of fixed cost assets or funds to magnify returns to the firm’s owners. The amount of leverage in the firm’s capital structure is the mix of long-term debt and equity maintained by the firm- can significantly affects its value by affecting return and risk. Because of its effect on value, the financial manager must understand how to measure and evaluate leverage, particularly when making capital structure decision.
There are three basic type of leverage- • Operating leverage • Financial leverage • Total leverage Operating Leverage: Operating leverage results from the existence of fixed operating costs in the firm’s income stream. We can define operating leverage as the potential use of fixed operating costs to magnify the effects of changes in sales on the firm’s earnings before interest and taxes (EBIT).
Measuring the degree of operating leverage (DOL): The degree of operating leverage (DOL) is defined as the percentage change in operating income- that is, earnings before interest and taxes or EBIT- associated with a given percentage change in sales. The degree of operating leverage is computed as: DOL = Percentage change in EBIT Percentage change in sales
Q (P – V) S – VC Gross Profit DOL for particular level of production and sales can be computed using the following equation: DOL = = = Here, Q = Initial units of output P = Average sales price per unit of output V = Variable cost per unit F = Fixed operating cost S = Initial sales in dollars VC = Total variable costs Q (P – V) – F S – VC – F EBIT
Example: Or, DOL = = = 1.67 X Thus, for every 1 percentage change (increase or decrease) in sales there will be a 1.67 percentage change (increase or decrease) in EBIT. A lower (higher) DOL suggest that lower (higher) risk is associated with the firm’s normal operating activities. S – VC 50000 – 25000 S – VC – F 50000 – 25000 – 10000
Financial Leverage: Financial leverage result from the presence of fixed financial costs in the firm’s income stream. We can define financial leverage as the potential use of fixed financial costs to magnify the effect of changes in earnings before interest and taxes (EBIT) on the firm’s earning per share (EPS). The two fixed financial costs that may be found on the firm’s income statement are (1) interest on debt, and (2) preferred stock dividends. These charges must be paid regardless of the amount of EBIT available to pay them.
Measuring the degree of financial leverage (DFL): The degree of financial leverage (DFL) is defined as the percentage change in earnings per share (EPS) that results from a given percentage change in earnings before interest and taxes (EBIT). The degree of financial leverage (DFL) is computed as: DFL = Percentage change in EPS Percentage change in EBIT
Thus, for every 1 percentage change (increase or decrease) in EBIT there will be a 5 percentage change (increase or decrease) in EPS. A lower (higher) DFL suggest that lower (higher) risk is associated with the firm’s financing- that is, the mix of debt and equity. Total Leverage: The potential use of fixed costs both operating and financial, to magnify the effect of changes in sales on the firm’s earnings per share. Total leverage can therefore be viewed as the total impact of the fixed costs in the firm’s operating and financial structure.
Measuring the degree of total leverage (DTL): The degree of total leverage (DTL) is defined as the percentage change in earnings per share (EPS) that results from a given percentage change in sales. DTL, shows the effects of both operating leverage and financial leverage. The degree of total leverage (DTL) is computed as: DTL = = (DOL) x (DFL) = = = Here, I = Interest cost Percentage change in sales Percentage change in EPS Q (P – V) Q (P – V) – F – I Gross Profit S – VC S – VC – F – I EBIT – I
Example: DTL = (DOL) x (DFL) = 1.67 x 5 = 8.35 Thus, for every 1 percentage change (increase or decrease) in sales there will be a 8.35 percentage change (increase or decrease) in EPS. A lower (higher) DTL suggest that lower (higher) risk is associated with the firm, both its business, risk and financial risk – that is, total risk.
The degree of leverage concept is useful primarily for the insights it provides regarding the joint effects of operating and financial leverage on earnings per share. The concept also can be used to show the management the effect of financing the firm with debt versus common stock. This also helps decision makers to generate a better idea of alternative financing plans, that is different capital structure.
Capital Structure Theory Scholarly research suggest that there is an optimal capital structure range. It is not yet possible to provide financial managers with a specified methodology for use in determining a firm’s optimal capital structure. Nevertheless, financial theory does offer help in understanding how a firm’s chosen financing mix affects the firm’s value. The generally theories of capital structure have been developed along two main lines: • Tax benefit/bankruptcy cost trade-off theory, and • Signaling theory
Trade-Off Theory Modern capital structure theory began in 1958. Professors Franco Modigliani and Merton Miller (MM), proved – under a very restrictive set of assumptions: No personal income tax, No brokerage costs, and No bankruptcy cost, that, due to tax deductibility of interest on corporate debt, a firm’s value rise continuously as more debt is used, and hence its value will be maximized by financing almost entirely with debt.
Because several of the assumptions outlined by MM obviously were and are unrealistic. Actually, MM’s position was only the beginning of capital structure research. Subsequent researchers, and MM themselves, extended the basic theory by relaxing the assumptions. Extended assumptions: • Interest is a tax deductible expense makes corporate debt less expensive than common or preferred stock. So the more debt a company uses, the higher its value. • MM assumptions do not hold in the real world: • Interest cost increases as debt/asset ratio increases • Expected tax rates fall at higher tax level, reduces the expected value of the debt tax shelter • Probability of bankruptcy increases (with lawyers’ fees and other costs) as the debt/asset ratio increases.
Pure MM result: Price of the stock if there were no bankruptcy-related costs Value of Firm’s stock Value added by debt tax shelter benefits Trade-off theory – graphical expression: Value reduced by bankruptcy- Related cost Actual price of stock Value of the stock with Zero Debt Value of stock if the firm used no Financial leverage D/A D/A 0 Leverage, D/A 1 2 Threshold debt level Where Bankruptcy costs become material Optimal capital structure: Marginal tax shelter benefit = Marginal bankruptcy-related costs
1 Beyond D/A , the bankruptcy-related costs, especially higher interest rates on new debt, become increasingly important, and they reduce the tax benefits of the debt at an increasing rate. In the range from D/A to D/A , bankruptcy-related cost reduce but do not completely offset tax benefits of debt, so the firm’s stock price rises at a decreasing rate as the debt/asset ratio increases. Beyond D/A bankruptcy-related costs exceed the tax benefits, so from this point on increasing the debt/asset ratio lowers the value of the stock. Therefore D/A is the optimal capital structure. 1 2 2 2
Signaling Theory MM assumed that investors have the same information about a firm’s prospects as its managers, this is called symmetric information. However, we know that in fact managers generally have better information about their firms than do outside investors, this is called asymmetric information. Asymmetric information, it has an important effect on decisions to use either debt or equity to finance capital projects. Why? Lets consider two situation:
Situation no 1: A firm find out an opportunity, and managers of that firm knew that the project’s prospects are extremely favorable. So to grab that opportunity the firm needs capital. How should the firm’s management raise needed capital? If the firm sell stock, then when firm make profit from that project, the price of the stock will rise sharply and new stock purchaser will made extra benefit. The current stockholders (including the managers) also will do well, but not as well as they would have if the firm had not sold new stock. Therefore, one would expect a firm with very favorable prospect to try to avoid selling stock and, rather, to raise any required new capital by other means, including using debt beyond the normal target capital structure.
Situation no 2: Because of high competition, a firm has to incur a large expenditure to maintain its current sales level and revenue. So to survive or to maintain its current level of, the firm needs capital. How should the firm’s management raise needed capital? Here the firm will not raise capital by debt, because it will bring additional risk (financial risk) and will try to share or spread risk among more investors. Therefore, a firm with unfavorable prospects would want to sell stock, which would mean bringing in new investors to share the losses.
The conclusions from all this are that firms with extremely bright prospects prefer not to finance through new stock offerings, whereas firms with poor prospects do like to finance with outside equity. Or, simply stated, the announcement of a stock offering by a mature firm that seems to have multiple financing alternatives is taken as a signal that the firm’s prospects as seen by its management are not bright. The implications of this theory to capital structure is that the firm should, in normal times, maintain a reserve borrowing capacity that can be used in the event that some especial good investment opportunity came. Reserve borrowing capacity: the ability to borrow money at a reasonable cost when good investment opportunities arise. Firms often use less debt than specified by the MM optimal capital structure to ensure that they can obtain debt capital later if necessary.
This means that firms should generally use less debt than would be suggested by the tax benefit/bankruptcy cost trade-off expressed in the graph. In truth, no one knew how to indentify precisely the optimal capital structure for a firm or how to measure precisely the effect of the firm’s capital structure on either its value or its cost of capital. In real life, capital structure decisions must be made on the basis of judgment than numerical analysis.