Download
1 / 12
120 likes | 287 Views
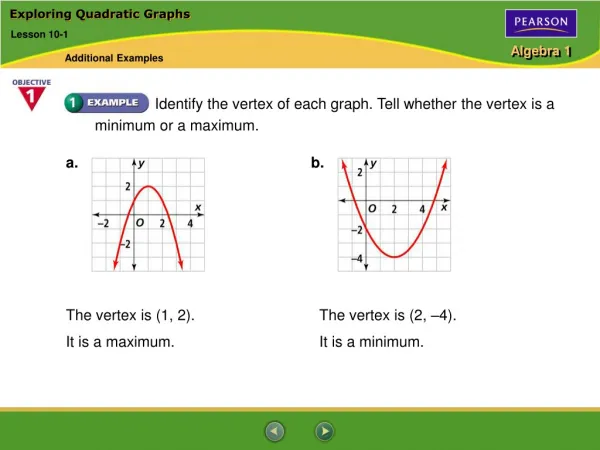
Quadratic and Trig Graphs. Learning Outcomes Revise solution of quadratic equation. Make tables of quadratic functions in order to make graphs. Investigate quadratics graphs. Given a series of equations and graphs, be able to match the correct equation with graph.

E N D
Quadratic and Trig Graphs • Learning Outcomes • Revise solution of quadratic equation. • Make tables of quadratic functions in order to make graphs. • Investigate quadratics graphs. • Given a series of equations and graphs, be able to match the correct equation with graph. • Be able to draw graphs of y = sinx, y = cosx, y = tanx and recognise important features.
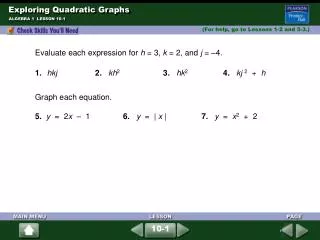
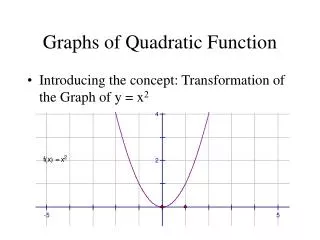
Quadratic & Trig Graphs add add Quadratic Equations Draw for -3 ≤ x ≤ 3 y a) y = x2 + 3x – 4 x y b) y = 2x2 – 3x – 5 x
Solving Simultaneous Equations Graphically Quadratic & Trig Graphs Solve x2 + 5x – t = x + 2 simultaneously y = x2 + 5x – t curve y = x + 2 straight line To solve these equations (graphically) we must draw the curve y= x2 + 5x and the line y = x + 2 and find the points of intersection.
Solving Simultaneous Equations Graphically Quadratic & Trig Graphs Given the equations of a curve (original) yes 1. Check LHS is original Draw ‘y = RHS’ no 2. Change LHS to original no 3. Draw ‘y = change’
Solving Simultaneous Equations Graphically Quadratic & Trig Graphs i) Draw for -2 ≤ x ≤ 5 the graph y = x2 – 3x – 3 ii) Use the graph to solve the equations a) x2 – 3x – 3 = 0 b) x2 – 3x – 3 = 4 c) x2 – 3x + 1 = 0 y x
Solving Simultaneous Equations Graphically Quadratic & Trig Graphs Draw ‘y = RHS’ yes Check LHS is original no Change LHS to original no Draw ‘y = change’ ii) Use the graph to solve the equations a) x2 – 3x – 3 = 0 b) x2 – 3x – 3 = 4 c) x2 – 3x + 1 = 0
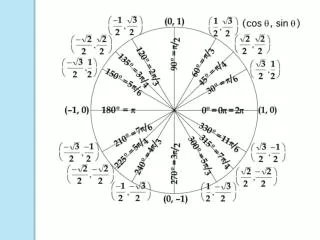
Graph of Trigonometrically Functions Quadratic & Trig Graphs y = sin x sin x 90 180 0 270 360 Use the above graph to solve a) sin x = 0.5 b) sin x = -0.3
Graph of Trigonometrically Functions Quadratic & Trig Graphs y = cos x cos x 90 180 0 270 360
Graph of Trigonometrically Functions Quadratic & Trig Graphs y = tan x tan x 90 180 0 270 360
Quadratic & Trig Graphs Trig Graphs Sketch basic trig graphs, know their key points and period (90, 1) Period = 360° y = sin x (180, 0) (0, 0) (360, 0) -1 ≤ y ≤ 1 (270, -1) (360, 1) (0, 1) y = cos x Period = 360° (270, 0) (90, 0) -1 ≤ y ≤ 1 (180, -1) y = tan x (45, 1) Period = 180° (360, 0) -∞≤ y ≤ ∞ (0, 0) (180, 0)
Quadratic & Trig Graphs Additional Notes
Quadratic and Trig Graphs Learning Outcomes: At the end of the topic I will be able to Can Revise Do Further • Revise solution of quadratic equation. • Make tables of quadratic functions in order to make graphs. • Investigate quadratics graphs. • Given a series of equations and graphs, be able to match the correct equation with graph. • Be able to draw graphs of y = sinx, y = cosx, y = tanx and recognise important features.