Download
1 / 26
630 likes | 1.39k Views
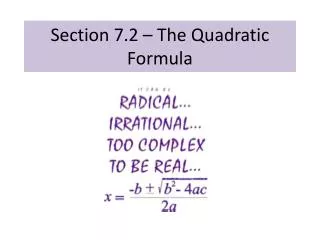
Quadratic Function: A function that can be written in the form y = ax 2 +bx+c where a ≠ 0. 9.1: QUADRATIC GRAPHS:. Standard Form of a Quadratic: A function written in descending degree order, that is ax 2 +bx+c. Quadratic Parent Graph: The simplest quadratic function f(x) = x 2 .

E N D
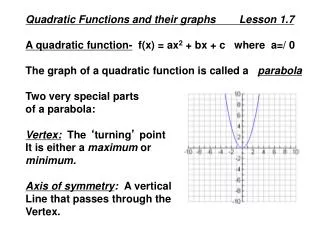
Quadratic Function: A function that can be written in the form y = ax2+bx+cwhere a ≠ 0. 9.1: QUADRATIC GRAPHS: Standard Form of a Quadratic: A function written in descending degree order, that is ax2+bx+c.
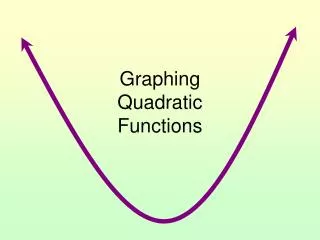
Quadratic Parent Graph: The simplest quadratic function f(x) = x2. Parabola: The graph of the function f(x) = x2. Axis of Symmetry: The line that divide the parabola into two identical halves Vertex: The highest or lowest point of the parabola.
Minimum: The lowest point of the parabola. Maximum: The highest point of the parabola. Line of Symmetry Vertex = Minimum
The vertex will always be the lowest or the highest point of the parabola. IDENTIFYING THE VERTEX: Ex:What are the coordinates of the vertex? 1) 2)
The vertex will always be the lowest or the highest point of the parabola. SOLUTION: Vertex: ( 0, 3) x =0 Line of Symmetry, y =3 is the Maximum
The vertex will always be the lowest or the highest point of the parabola. SOLUTION: Vertex: ( -2, -3) x = -2 Line of Symmetry, y = -3 is the Minimum
Remember that when we do not know what something looks like, we always go back to our tables. GRAPHING y = ax2: Ex:Graph y = x2. Make a table and provide the Domain and Range.
GRAPHING: = -2 (1/3)∙(-2)2 = (1/3)∙(-1)2 -1 0 (1/3)∙(0)2 0 = 0 = 1 (1/3)∙(1)2 = (1/3)∙(2)2 2
GRAPHING: -2 -1 0 0 1 2 Domain (-∞, ∞) Range: (0, ∞)
USING TECHNOLOGY: What is the difference and Similarities of :1) y = x2 2) y = 4x2 3) y = -4x2 4) y = x2 5) y = - x2
USING TECHNOLOGY: Graphing calculators can aid us on looking at properties of functions: y = x2 Vertex: (0,0) Domain: (- ∞, ∞) Range: (0, ∞)
USING TECHNOLOGY: Graphing calculators can aid us on looking at properties of functions: y = 4x2 Vertex: (0,0) Domain: (- ∞, ∞) Range: (0, ∞)
USING TECHNOLOGY: Graphing calculators can aid us on looking at properties of functions: y = -4x2 Vertex: (0,0) Domain: (- ∞, ∞) Range: (- ∞, 0)
USING TECHNOLOGY: Graphing calculators can aid us on looking at properties of functions: y = x2 Vertex: (0,0) Domain: (- ∞, ∞) Range: (0, ∞)
USING TECHNOLOGY: Graphing calculators can aid us on looking at properties of functions: y = - x2 Vertex: (0,0) Domain: (- ∞, ∞) Range: (- ∞, 0)
Notice:if coefficient is positive: Parabola facesUP y=4x2 y=x2 y= x2 if coefficient is Negative: Parabola faces DOWN if coefficient is > 1: Parabola is Skinny if coefficient is Between 0 and 1: Parabola is wide y = - x2 y= -4x2
USING TECHNOLOGY: What is the difference and Similarities of : 1) y = 4x2+2 2) y = 4x2-2 3) y = -4x2+24) y = -4x2-2
Notice: Y = a(x-h)2 +k y = 4x2+2 Y = a(x-h) 2+k +a faces up +k shift up y = 4x2-2 Y = a(x-h) 2-k +a faces up -k shift down
Notice: Y = a(x-h)2 +k y = -4x2+2 Y =-a (x-h) 2+k -a faces down +k shift up Y = -a(x-h) 2-k -a faces down y = -4x2-2 -k shift down
REAL-WORLD: A person walking across a bridge accidentally drops and orange into the rives below from a height of 40 ft. The function h = -16t2 + 40 gives the orange’s height above the water, in feet, after t seconds. Graph the function. In how many seconds will the orange hit the water?
GRAPHING: Notice:We stop after we get a negative height as we Cannot go beyond the ground. =40 0 40 -16∙(0)2+40 =24 -16∙(1)2+40 24 1 -24 -16∙(2)2+40 = -24 2
Once again: Seconds (t) must start at 0 t = 0 SOLUTION: Height (h) Height (h) must stop at 0 h = 0 Thus: our orange will take about 1.6 seconds to hit the ground. Seconds (t)
VIDEOS: Quadratic Graphs and Their Properties Graphing Quadratics: http://www.khanacademy.org/math/algebra/quadratics/graphing_quadratics/v/graphing-a-quadratic-function Interpreting Quadratics: http://www.khanacademy.org/math/algebra/quadratics/quadratic_odds_ends/v/algebra-ii--shifting-quadratic-graphs
VIDEOS: Quadratic Graphs and Their Properties Graphing Quadratics: http://www.khanacademy.org/math/algebra/quadratics/graphing_quadratics/v/quadratic-functions-1
CLASSWORK:Page 537-539: Problems: 1, 2, 3, 4, 7, 8, 10, 13, 19, 27, 28, 34 39.