Download
1 / 40
400 likes | 581 Views
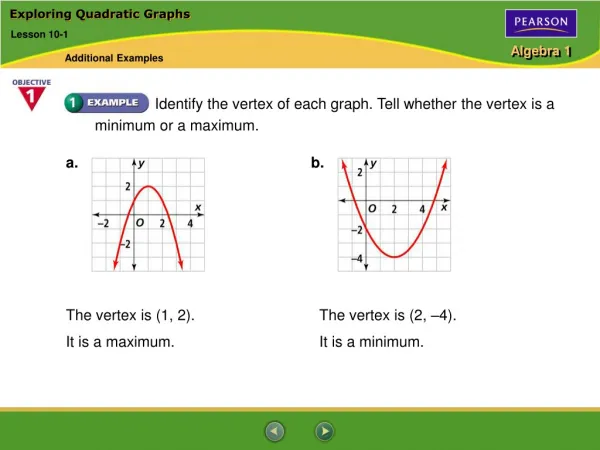
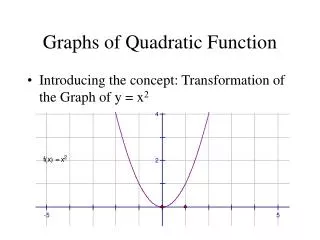
Introduction to Quadratic Graphs. Prior Knowledge: Properties of Linear Graphs What are the basic properties of a linear graph ?. So, We K now A bout the Main P roperties of L inear Graphs. However, not everything can be described using a linear (straight line) graph. Let’s Begin.

E N D
Introduction to Quadratic Graphs Prior Knowledge: Properties of Linear Graphs What are the basic properties of a linear graph?
So, We Know About the Main Properties of Linear Graphs However, not everything can be described using a linear (straight line) graph.
Let’s Begin... • There is a mythical creature called a “Walkasaurs” • The table provided shows how “Walkasaurs” height changes with time
Points to Ponder... • Do you notice a pattern in the rate of growth of the walkasaurus? • Is the change in height each year the same? (a constant number) • Can you complete the table for the remaining years? • If I draw this graph will it be a straight line(linear) ? • Why or why not?
Drawing the graph • Complete the table and plot the graph.
The Graph 45 40 35 30 25 Height (metres) 20 15 10 5 0 2 4 6 8 10 12 14 16 18 20 Time (years)
Finding the Pattern The first change is not a constant number, as is the case in a linear graph, however the 2nd change is a constant, this is one of the properties of a quadratic graph.
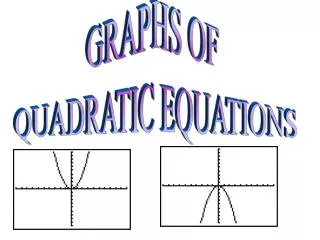
Motor Cyclist The image below shows a motor cycle jumping a ramp. What “shape” is the path that the motor cycle follows?
The graph is curved, lets look at it in some more detail.. Is this the graph of a quadratic? Your Turn..See Handout 1.7 Pg. 5
Finding the Pattern Note: The second differences (or changes) are constant, therefore the graph is Quadratic
Aeroplane Lift Off For a given wing area the lift of an aeroplane is proportional to thesquare of its speed. The table below shows the lift of a Boeing 747jet airline at various speeds. (a) Is the pattern of lifts quadratic? Give a reason for your answer. (b) Sketch the graph to show how the lift increases with speed. A Boeing 747 weighs 46000 Newtons at takeoff . (c) Estimate how fast the plane must travel to get enough lift to take flight. (d) Explain why bigger planes need longer runways.
Because the second differences are constant, the pattern is quadratic. Lift (N) See Geogebra File Speed (km/h)
Angry Birds!! Table of Values:
Angry Birds!! See Geogebra file Table of Values:
Your turn.. See handout Growing Squares Pattern. Draw the next two patterns of growing squares.
Create a List of the Properties of Quadratic Graphs • They are curved. • The 1st change is not constant, but the 2nd change is constant • They can occupy all 4 quadrants of the plane
Cubic Graphs As previously discussed, not every thing can be described by a straight line, nor can everything be described by a “ ” or “ ” shaped curve. Lets take a look at the shape of a roller coaster. It looks like 2 quadratics stuck together. But does it have the properties of a quadratic, i.e. The second differences will be constant?
Bird Journey See animated power point on bird graph Initial height = 0 m
Looking at the Data The distance the bird travelled and its change in height relative to its starting position is given in the table below: If we were to graph this data, what shape would the graph be?
Looking at the Change in the Data First change not a constant, so graph will not be LINEAR Second change not a constant, so graph will not be QUADRATIC Third change is a constant, this means the graph is a CUBIC
Graph of Bird’s Journey (2,12) (4,0) (5,–12) (8,0) H (7,–18) (3,10) (6,–20) Change in height(m) [Relative to starting position] Distance travelled (m) [Relative to starting position]
Using a Cube to Investigate Cubic Functions Vertex For a cube with edge lengths of 1 unit, the perimeter of the base is 4 units, the surface area is 6 square units And the volume is 1 cubic unit. What would the values be for a block with edge lengths of 2 units or 3 units or 34 units or n units? Make tables for perimeter, for surface area and for volume as the edge lengths of the block increase. Examine the tables to predict the shape of the graph for each of the three relationships. Explain your predictions. Make the graphs for perimeter vs. edge length, surface area vs. edge length and volume vs. edge length and compare them with your predictions. Edge Face 1 unit
Introducing Exponential Functions Recognize and describe an exponential pattern. Use an exponential pattern to predict a future event. Compare exponential and logistic growth.
Recognising an Exponential Pattern • A sequence of numbers has an exponential pattern when each successive number increases (or decreases) by the same percent. • Here are some examples of exponential patterns: • Growth of a bacteria culture • Growth of a mouse population during a mouse plague • Decrease in the atmospheric pressure with increasing height • Decrease in the amount of a drug in your bloodstream
Recognising an Exponential Pattern Describe the pattern for the volumes of consecutive chambers in the shell of a chambered nautilus. Source: Larson Texts Solution: It helps to organize the data in a table. Begin by checking the differences of consecutive volumes.
Recognising an Exponential Pattern Begin by checking the differences of consecutive volumes to conclude that the pattern is not linear or Quadratic. Then find the ratios of consecutive volumes.
Checking the Ratios The volume of each chamber is about 6.3% greater than the volume of the previous chamber. So, the pattern is exponential. Notice the difference between linear and exponential patterns. With linear patterns,successive numbers increase or decrease by the same amount. Withexponentialpatterns, successive numbers increase or decrease by the same ratio.
Who Will Do Better? You and your friend have both been offered a job on a construction site. Both of you will have to work 28 consecutive days to finish the project. Your friend is offered €25,000 per week. (for 4 weeks) You negotiate your contact as follows: You can pay me 2 cent for the first day, 4 cent for the second day, 8 cent for the third day, and so on, just double my pay each day for 28 days. Who has negotiated the better deal?
End of Week 1 So at the end of week 1, You have earned €5.10, but your friend has earned €25,000. It would seem your friend has secured the better deal !
Table for the First 10 Days View Handout
But...What Will Happen After 28 Days? Your final days pay will be €5,368,709.12 Not bad for one days work!
Both Graphs the Same but the Scales are Different Tripling my pay Tripling my pay Doubling my pay Doubling my pay
Exponential Graphs: Equation Intervals of time Final Amount Starting Value Growth Factor
Table for the First 10 Days View handout Can you identify how the variables in the above formula relate to the values in the table?
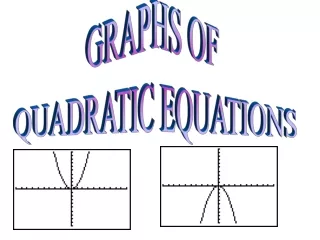
Identifying Graphs..Your turn Graph 1 Graph 2 Graph 3 Graph 4 Below are 4 sections of 4 different graphs, using the data provided, identify each type of graph, and give a reason for your answer.
Conclusion • If a graph is Linear, the first change is constant • If a graph is quadratic, the second change is constant • If a graph is a cubic, the third change is constant • If a graph is exponential, successive numbers increase or decrease by the same ratio.