Download
1 / 101
1.03k likes | 1.17k Views
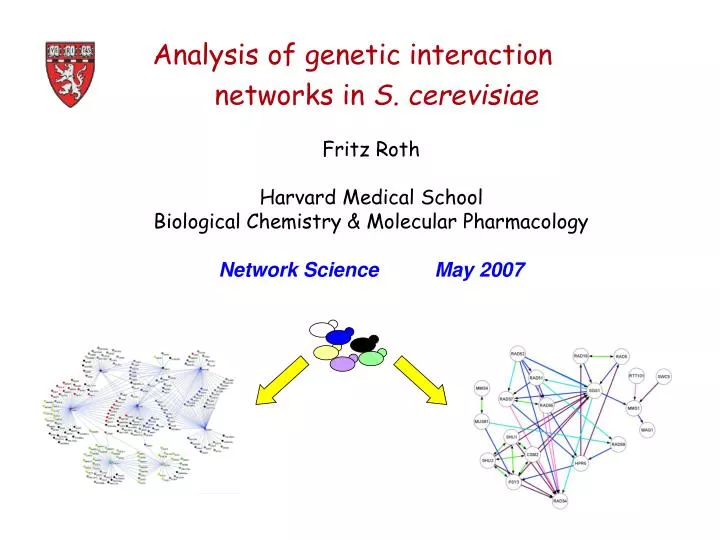
Analysis of genetic interaction networks in S. cerevisiae. Fritz Roth Harvard Medical School Biological Chemistry & Molecular Pharmacology Network Science May 2007. A Simplified Organism. Vertices (or nodes ) are genes Edges (or links ) are gene pairs. Outline. Background:

E N D
Analysis of genetic interaction networks in S. cerevisiae Fritz Roth Harvard Medical School Biological Chemistry & Molecular Pharmacology Network Science May 2007
A Simplified Organism Vertices (or nodes) are genes Edges (or links) are gene pairs
Outline • Background: A big map of synthetic genetic interaction • A smaller ‘multicolor’ map of genetic interaction
What is synthetic interaction? Gene X Gene Y Cells live Cells live Cells die Gene X Gene Y Gene X Gene Y
What is synthetic sickness/lethality (SSL)? Gene X Gene Y Cells live Cells live Cells die or grow slowly Gene X Gene Y Gene X Gene Y
A known sub-network of SSL interactions • A Canadian consortium (Boone et al.) has made many double mutants • As of 2001: 8 query genes x 4500 nonessential “array” genes ≈ 36,000 tested pairs (Tong et al., Science, 2001)
The 2001 network (~300 interactions) (Tong et al., Science, 2001)
The known SSL sub-network circa 2004 • 159 query genes x 4500 nonessential genes • 700,000 pairs (~4% of all pairs) Imagine a lovely but uninterpretable hairball here (Tong et al., Science 2004)
3 partially redundant pathways, 2 required Protein complex tolerating 1 but not 2 mutations B H H B K A F A J F G E C G E C L B A C D D M E F D I I Explanations for synthetic interaction Partially redundant genes 2 partially redundant pathways A B C1 C2 D E
Predicting synthetic interaction: Probabilistic decision trees
Predicting synthetic interaction: Cross-validation success ~80% sensitivity by testing ~20% of gene pairs (80/20 Rule!)
Outline • A big map of synthetic genetic interaction • A smaller ‘multicolor’ map of genetic interaction (a case study of systematic genetic analysis) • The experiment • Classifying genetic interaction • Predicting shared function • Reconstructing a DNA repair pathway
The experiment Identify mutants sensitive to DNA damage (MMS) Make all double mutants Measure fitness of all strains +/- drug
rad18 rad5 rad52 sgs1 mms1 rad54 rad51 rad57 rtt101 rad55 rtt107 mus81 mms4 rad59 mag1 hpr5 cla4 shu1 psy3 csm2 shu2 mph1 Growth Rate in Mutant csm3 swc5 Fitness (W) = rad61 slx4 Growth Rate of Wild Type 0.2 0.4 0.6 0.8 1.0 1.2 0 MMS Sensitive Deletion Strains Deletion Strain
mph1 shu1 shu2 csm2 psy3 rad51 rad52 rad54 rad57 rad59 csm3 rtt101 rtt107 mms4 mus81 hpr5 rad5 rad18 mag1 cla4 swc5 mms1 rad55 rad61 slx4 sgs1 Natr mph1 shu1 shu2 csm2 psy3 rad51 rad52 rad54 rad57 rad59 csm3 rtt101 rtt107 mms4 mus81 hpr5 rad5 rad18 mag1 cla4 swc5 mms1 rad55 rad61 slx4 sgs1 Kanr The experiment: 26x26 double-mutants 52 single mutants 650 double mutants
XΔ OD595 time YPD Growth Rate in Mutant Doubling Time of Wild Type Fitness (W) = YPD + 0.002% MMS Growth Rate of Wild Type Doubling Time of Mutant The experiment: Measuring fitness =
Outline • A big map of synthetic genetic interaction • A smaller ‘multicolor’ map of genetic interaction (a case study of systematic genetic analysis) • The experiment • Classifying genetic interaction • Predicting shared function • Reconstructing a DNA repair pathway
Gene X Gene Y Gene X Gene Y Gene X Gene Y A fundamental question Cell growth is 50% of wt (Wx = 50%) Cell growth is 80% of wt (Wy = 80%) Wxy = ?
for non-interacting genes Wx ∙ Wy Wx Wy X Non-interactinge = 0 Y Wxy Wx ∙ Wy Wx Wy Alleviating e> 0 Wx ∙ Wy Wx Wy Synergistice < 0 X Y X Y Wxy Wxy The Product model
Distribution of epsilon ( ) Neutral Synergistic Alleviating
Network(Synergistic) Wx∙Wy Wx Wy
Sx Sy Swt Count 9 6 15 12 4 Sy= Sx Swt MMS Sensitivity (S) MMS Sensitivity (S) Classifying alleviating interactions Growth Rate w/ Drug Drug Sensitivity (S) = Growth Rate w/o Drug Alleviating Interaction Type co-equality partial masking masking partial suppression suppression
Wx∙Wy Wx Wy Sx Sy Swt Sxy Sxy Sy= Sx Swt MMS Sensitivity (S) MMS Sensitivity (S) Network (alleviating)
Wx∙Wy Wx Wy Sx Sy Swt Sy= Sx Swt MMS Sensitivity (S) MMS Sensitivity (S) Network (alleviating)
Outline • A big map of synthetic genetic interaction • A smaller ‘multicolor’ map of genetic interaction (a case study of systematic genetic analysis) • The experiment • Classifying genetic interaction • Predicting shared function • Reconstructing a DNA repair pathway
Distribution of epsilon ( ) Neutral Synergistic Alleviating
Genetic congruence* Credits – *concept:Tong et al, Science 2004; coined by: Ye et al, BMC Bioinformatics Illustration and extension: Segre et al., Nature Genetics (2005)
more synergistic more alleviating Clustered epsilon profiles (‘genetic congruence’) Endonuclease Complex with HR role PRR Complex Homologous Recombination Helicases, Sgs1 has known HR role
Quantitative genetic interactions predictfunctional relationships
Outline • A big map of synthetic genetic interaction • A smaller ‘multicolor’ map of genetic interaction (a case study of systematic genetic analysis) • The experiment • Classifying genetic interaction • Predicting shared function • Reconstructing a DNA repair pathway
Wx∙Wy Wx Wy Sx Sy Swt Sxy Sxy Sy= Sx Swt MMS Sensitivity (S) MMS Sensitivity (S) Network (alleviating)
Sx Sy Swt Sy= Sx Swt MMS Sensitivity (S) MMS Sensitivity (S) HR Network
Sx Sy Swt Sy= Sx Swt MMS Sensitivity (S) MMS Sensitivity (S) HR Network
Sx Sy Swt Sy= Sx Swt MMS Sensitivity (S) MMS Sensitivity (S) HR Network (Rothstein et al; reviewed Broomfield et. al)
Wx∙Wy Wx Wy Sx Sy Swt Sxy Sxy Sy= Sx Swt MMS Sensitivity (S) MMS Sensitivity (S) Network (alleviating)
Summary • Genetic interactions are useful • Multiple genetic interaction subtypes • Here, most functional links are alleviating • Co-equal interactions cohesive units • Synthetic interactions parallel roles • Alleviating interactions pathway order
Roth Lab Mani Ramamurthy Joe Mellor Others Canadian Synthetic Genetic Team Charlie Boone Brenda Andrews Howard Bussey Many others! Stanford/Toronto axis Bob St. Onge Guri Giaever Corey Nislow Ronald Davis Many Others Marc Vidal Acknowledgments
3 partially redundant pathways, 2 required B H H B K A F A J F G E C G E C L D M D I I Scenarios resulting in synthetic interaction Partially redundant genes 2 partially redundant pathways Protein complex tolerating 1 but not 2 destabilizing mutations A B B C1 A C2 C D D E F E < 2% < 4% * SSL
Predicting synthetic interaction: Why? • Especially if the consortia led by Boone and Boeke • are testing all yeast gene pairs • Simple Answer: • Even finished, this project is one strain, one phenotype (growth), one growth condition, and one organism.