Download
1 / 2

E N D
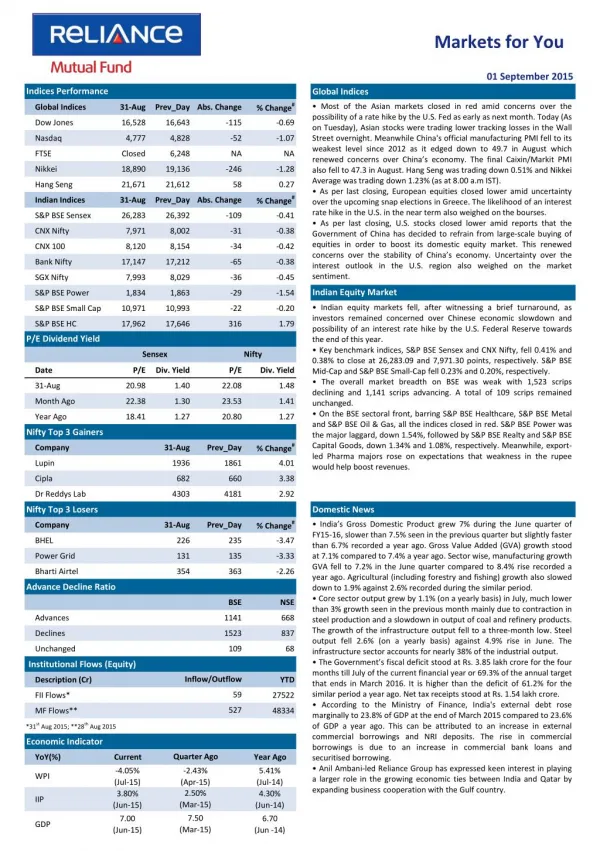
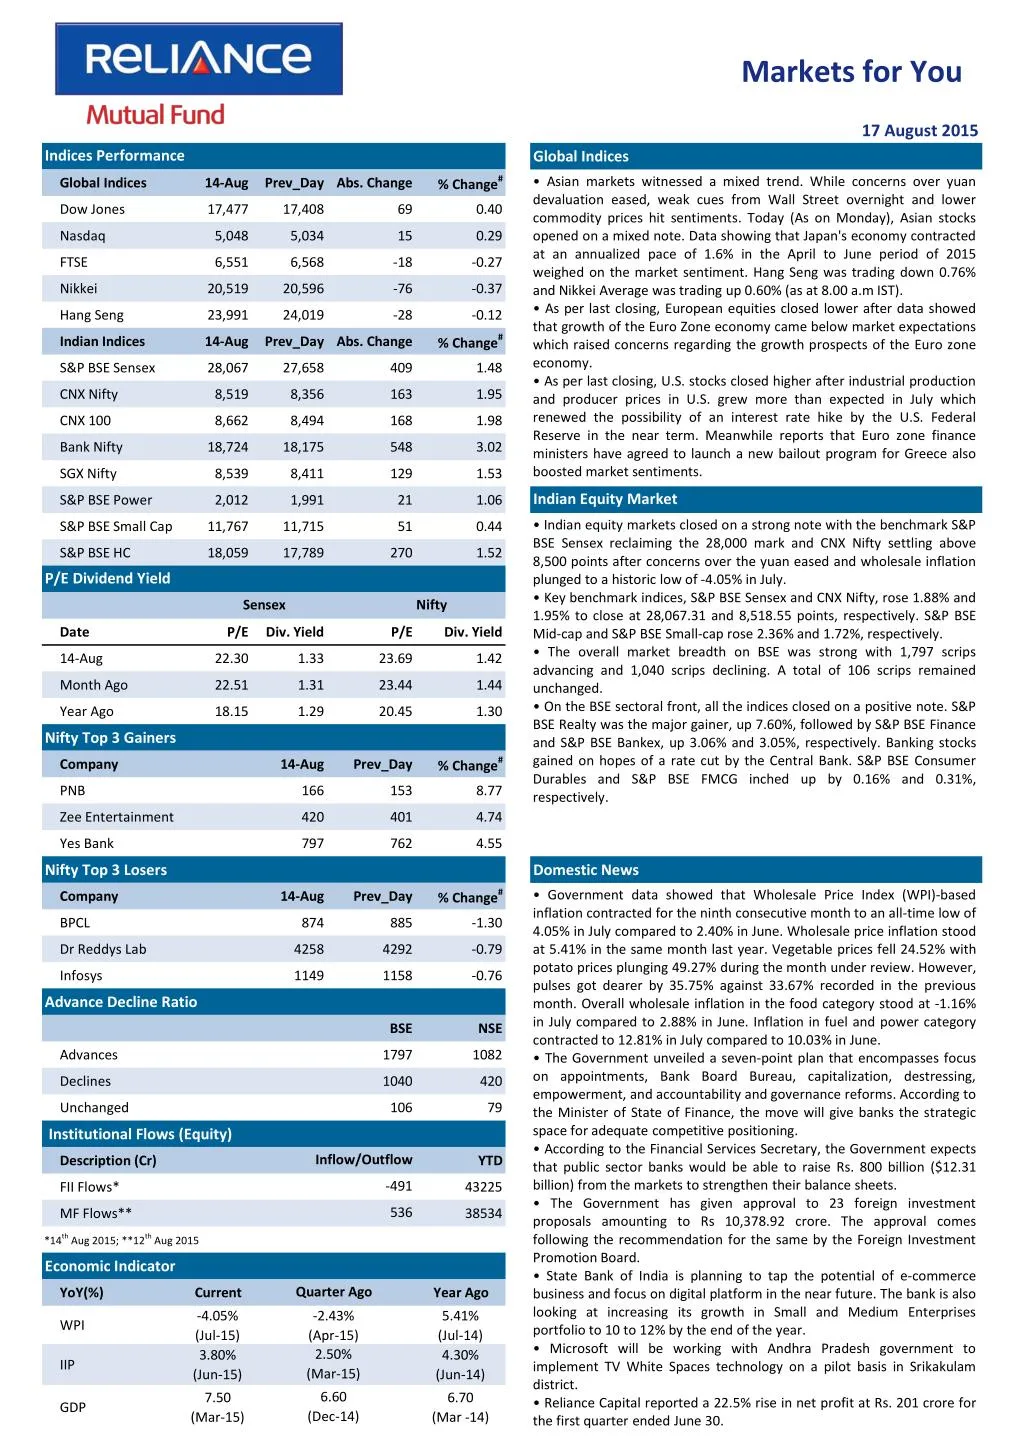
Markets for You 17 August 2015 Indices Performance Global Indices % Change# • Asian markets witnessed a mixed trend. While concerns over yuan devaluation eased, weak cues from Wall Street overnight and lower commodity prices hit sentiments. Today (As on Monday), Asian stocks opened on a mixed note. Data showing that Japan's economy contracted at an annualized pace of 1.6% in the April to June period of 2015 weighed on the market sentiment. Hang Seng was trading down 0.76% and Nikkei Average was trading up 0.60% (as at 8.00 a.m IST). • As per last closing, European equities closed lower after data showed that growth of the Euro Zone economy came below market expectations which raised concerns regarding the growth prospects of the Euro zone economy. • As per last closing, U.S. stocks closed higher after industrial production and producer prices in U.S. grew more than expected in July which renewed the possibility of an interest rate hike by the U.S. Federal Reserve in the near term. Meanwhile reports that Euro zone finance ministers have agreed to launch a new bailout program for Greece also boosted market sentiments. Global Indices 14-Aug Prev_Day Abs. Change Dow Jones 17,477 17,408 69 0.40 Nasdaq 5,048 5,034 15 0.29 FTSE 6,551 6,568 -18 -0.27 Nikkei 20,519 20,596 -76 -0.37 Hang Seng 23,991 24,019 -28 -0.12 % Change# Indian Indices 14-Aug Prev_Day Abs. Change S&P BSE Sensex 28,067 27,658 409 1.48 CNX Nifty 8,519 8,356 163 1.95 CNX 100 8,662 8,494 168 1.98 Bank Nifty 18,724 18,175 548 3.02 SGX Nifty 8,539 8,411 129 1.53 Indian Equity Market S&P BSE Power 2,012 1,991 21 1.06 • Indian equity markets closed on a strong note with the benchmark S&P BSE Sensex reclaiming the 28,000 mark and CNX Nifty settling above 8,500 points after concerns over the yuan eased and wholesale inflation plunged to a historic low of -4.05% in July. • Key benchmark indices, S&P BSE Sensex and CNX Nifty, rose 1.88% and 1.95% to close at 28,067.31 and 8,518.55 points, respectively. S&P BSE Mid-cap and S&P BSE Small-cap rose 2.36% and 1.72%, respectively. • The overall market breadth on BSE was strong with 1,797 scrips advancing and 1,040 scrips declining. A total of 106 scrips remained unchanged. • On the BSE sectoral front, all the indices closed on a positive note. S&P BSE Realty was the major gainer, up 7.60%, followed by S&P BSE Finance and S&P BSE Bankex, up 3.06% and 3.05%, respectively. Banking stocks gained on hopes of a rate cut by the Central Bank. S&P BSE Consumer Durables and S&P BSE FMCG inched up by 0.16% and 0.31%, respectively. S&P BSE Small Cap 11,767 11,715 51 0.44 S&P BSE HC 18,059 17,789 270 1.52 P/E Dividend Yield Sensex Nifty Date P/E Div. Yield P/E Div. Yield 14-Aug 22.30 1.33 23.69 1.42 Month Ago 22.51 1.31 23.44 1.44 Year Ago 18.15 1.29 20.45 1.30 Nifty Top 3 Gainers % Change# Company 14-Aug Prev_Day PNB 166 153 8.77 Zee Entertainment 420 401 4.74 Yes Bank 797 762 4.55 Nifty Top 3 Losers Domestic News % Change# • Government data showed that Wholesale Price Index (WPI)-based inflation contracted for the ninth consecutive month to an all-time low of 4.05% in July compared to 2.40% in June. Wholesale price inflation stood at 5.41% in the same month last year. Vegetable prices fell 24.52% with potato prices plunging 49.27% during the month under review. However, pulses got dearer by 35.75% against 33.67% recorded in the previous month. Overall wholesale inflation in the food category stood at -1.16% in July compared to 2.88% in June. Inflation in fuel and power category contracted to 12.81% in July compared to 10.03% in June. • The Government unveiled a seven-point plan that encompasses focus on appointments, Bank Board Bureau, capitalization, destressing, empowerment, and accountability and governance reforms. According to the Minister of State of Finance, the move will give banks the strategic space for adequate competitive positioning. • According to the Financial Services Secretary, the Government expects that public sector banks would be able to raise Rs. 800 billion ($12.31 billion) from the markets to strengthen their balance sheets. • The Government has given approval to 23 foreign investment proposals amounting to Rs 10,378.92 crore. The approval comes following the recommendation for the same by the Foreign Investment Promotion Board. • State Bank of India is planning to tap the potential of e-commerce business and focus on digital platform in the near future. The bank is also looking at increasing its growth in Small and Medium Enterprises portfolio to 10 to 12% by the end of the year. • Microsoft will be working with Andhra Pradesh government to implement TV White Spaces technology on a pilot basis in Srikakulam district. • Reliance Capital reported a 22.5% rise in net profit at Rs. 201 crore for the first quarter ended June 30. Company 14-Aug Prev_Day BPCL 874 885 -1.30 Dr Reddys Lab 4258 4292 -0.79 Infosys 1149 1158 -0.76 Advance Decline Ratio BSE NSE Advances 1797 1082 Declines 1040 420 Unchanged 106 79 Institutional Flows (Equity) Inflow/Outflow Description (Cr) YTD -491 FII Flows* 43225 536 MF Flows** 38534 *14th Aug 2015; **12th Aug 2015 Economic Indicator Quarter Ago YoY(%) Current Year Ago -4.05% (Jul-15) 3.80% (Jun-15) -2.43% (Apr-15) 2.50% (Mar-15) 5.41% (Jul-14) 4.30% (Jun-14) WPI IIP 6.60 (Dec-14) 7.50 6.70 GDP (Mar-15) (Mar -14)
Markets for You 17 August 2015 Derivatives Market FII Derivative Trade Statistics 14-Aug • Nifty August 2015 Futures were at 8,542.70 points, a premium of 24.15 points against the spot closing of 8,518.55 points. The turnover on NSE’s Futures and Options segment rose from Rs. 2,47,905.55 crore in August 13 to Rs. 2,88,001.22 crore on August 14. • The Put-Call ratio stood at 0.93, compared to the previous session’s close of 0.89. • The Nifty Put-Call ratio stood at 1.00, compared to the previous session’s close of 0.88. • The open interest on Nifty Futures stood at 16.30 million compared to the previous session’s close of 16.64 million. (Rs Cr) Buy Sell Open Int. Index Futures 864.19 1099.55 14810.82 Index Options 14709.59 13766.64 74974.51 Stock Futures 2831.72 2639.18 50869.04 Stock Options 2790.00 2771.27 3549.26 Total 21195.50 20276.64 144203.63 Derivative Statistics- Nifty Options 14-Aug Prev_Day Change Indian Debt Market Put Call Ratio (OI) 1.00 0.88 0.12 • Bond yields edged up as investors resorted to profit booking following recent rally in the bond markets after consumer price inflation fell to a record low in July. However, losses were restricted after wholesale price inflation contracted for the ninth consecutive month in July which raised hopes of further monetary easing by the Reserve Bank of India. • The yield on the 10-year benchmark bond, 7.72% GS 2025, rose by 1 bps to close at 7.75% compared to the previous day’s close of 7.74%. The paper moved in the range of 7.73% to 7.75% earlier during the trading session. • The RBI conducted the auction of 7.68% Government Stock (GS) 2023, 7.72% GS 2025, 8.24% GS 2033 and 8.13% GS 2045 worth Rs. 14,000 crore, for which the cut-off stood at Rs. 98.76 (7.88%), Rs. 99.81 (7.75%), Rs. 102.16 (8.01%) and Rs. 101.78 (7.97%), respectively. Put Call Ratio(Vol) 0.99 0.93 0.06 Debt Watch 14-Aug Wk. Ago Mth. Ago Year Ago Call Rate 7.07% 7.12% 7.07% 8.36% CBLO 7.19% 6.78% 7.16% 8.50% Repo 7.25% 7.25% 7.25% 8.00% Reverse Repo 6.25% 6.25% 6.25% 7.00% 91 Day T-Bill 7.25% 7.40% 7.37% 8.42% 364 Day T-Bill 7.54% 7.55% 7.57% 8.67% 10 Year Gilt 7.75% 7.81% 7.82% 8.52% Currency Market Update • The rupee rose against the dollar after weakening for seven consecutive sessions on fresh selling of the greenback by banks and exporters. Gains in the domestic equity markets also boosted the rupee. The domestic currency inched up by 0.15% to close at 65.00 compared to the previous close of 65.10. • The euro rose marginally on the back of mixed U.S. economic data, which renewed uncertainty over the interest outlook in the U.S. region. The euro was trading higher at $1.1151 compared to the previous close of $1.1148. G-Sec Vol. (Rs.Cr) 55233 26185 36727 41155 1 Month CP Rate 7.46% 7.49% 7.78% 8.69% 3 Month CP Rate 7.74% 7.80% 8.01% 9.15% 5 Year Corp Bond 8.40% 8.44% 8.56% 9.32% 1 Month CD Rate 7.30% 7.30% 7.42% 8.43% 3 Month CD Rate 7.47% 7.49% 7.71% 8.84% 1 Year CD Rate 7.85% 7.89% 8.06% 9.09% Currency Market Commodity Market Update • Gold prices rose as investors remained optimistic ahead of a series of U.S. economic data. • Brent crude prices traded near 6-year lows as worries over an imminent rate hike by the U.S. Fed and sustained concerns over a global supply glut weighed on commodity prices. Currency 14-Aug Prev_Day Change USD/INR 65.12 64.92 0.20 GBP/INR 101.62 101.44 0.18 International News EURO/INR 72.56 72.26 0.30 • The U.S. Labour Department in its report showed that the producer price index edged up by 0.2% in July after rising by 0.4% in June. Excluding food and energy prices, the core producer price index rose by 0.3% in July, matching the increase seen in the previous month. • Preliminary data from Eurostat showed that Gross Domestic Product expanded 0.3% sequentially in the June quarter of 2015. On a yearly basis, GDP growth improved to 1.2% from 1%. Germany's growth improved to 0.4% in the second quarter from 0.3% seen in the first quarter. • Final data from Eurostat showed that consumer price inflation in Euro zone stood at 0.2% in July, the same rate as seen in June. On a monthly basis, consumer prices fell 0.6%. JPY/INR 0.52 0.52 0.00 Commodity Prices Currency 14-Aug Wk Ago Mth. Ago Year Ago NYMEX Crude($/bl) 42.45 43.87 53.05 95.54 Brent Crude($/bl) 47.49 47.74 57.10 101.05 Gold( $/oz) 1114 1094 1155 1313 Gold(Rs./10 gm) 25690 24668 25858 28324 Source: ICRON Research Disclaimer: “The information herein is meant only for general reading purposes and contains all factual and statistical information pertaining to Industry and markets which have been obtained from independent third-party sources and which are deemed to be reliable. The information provided cannot be considered as guidelines, recommendations or as a professional guide for the readers. It may be noted that since RCAM has not independently verified the accuracy or authenticity of such information or data, or for that matter the reasonableness of the assumptions upon which such data and information has been processed or arrived at; RCAM does not in any manner assures the accuracy or authenticity of such data and information. Some of the statements & assertions contained in these materials may reflect RCAM’s views or opinions, which in turn may have been formed on the basis of such data or information. The Sponsor, the Investment Manager, the Trustee or any of their respective directors, employees, affiliates or representatives do not assume any responsibility for, or warrant the accuracy, completeness, adequacy and reliability of such data or information. Whilst no action has been solicited based upon the information provided herein, due care has been taken to ensure that the facts are accurate and opinions given are fair and reasonable, to the extent possible. This information is not intended to be an offer or solicitation for the purchase or sale of any financial product or instrument. Recipients of this information should rely on information/data arising out of their own investigations. Before making any investments, the readers are advised to seek independent professional advice, verify the contents in order to arrive at an informed investment decision. None of the Sponsor, the Investment Manager, the Trustee, their respective directors, employees, affiliates or representatives shall be liable in any way for any direct, indirect, special, incidental, consequential, punitive or exemplary damages, including on account of lost profits arising from the information contained in this material. Mutual Fund Investments are subject to market risks, read all scheme related documents carefully.