Download
1 / 2
20 likes | 202 Views
Find out the information what is happening in Indian Market.

E N D
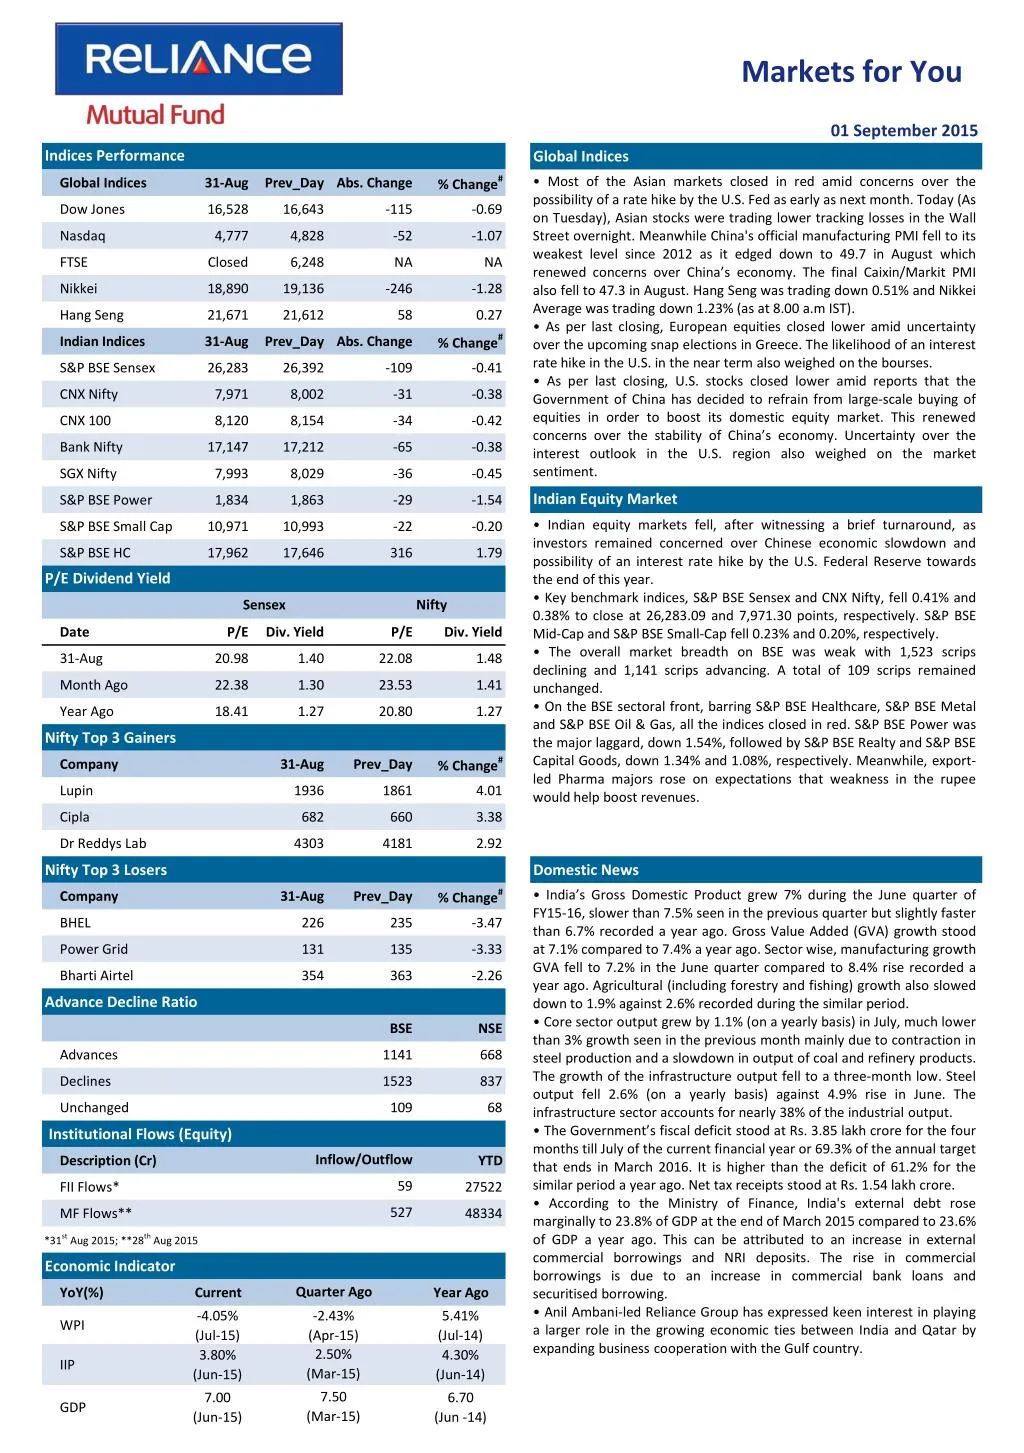
Markets for You 01 September 2015 Indices Performance Global Indices % Change# • Most of the Asian markets closed in red amid concerns over the possibility of a rate hike by the U.S. Fed as early as next month. Today (As on Tuesday), Asian stocks were trading lower tracking losses in the Wall Street overnight. Meanwhile China's official manufacturing PMI fell to its weakest level since 2012 as it edged down to 49.7 in August which renewed concerns over China’s economy. The final Caixin/Markit PMI also fell to 47.3 in August. Hang Seng was trading down 0.51% and Nikkei Average was trading down 1.23% (as at 8.00 a.m IST). • As per last closing, European equities closed lower amid uncertainty over the upcoming snap elections in Greece. The likelihood of an interest rate hike in the U.S. in the near term also weighed on the bourses. • As per last closing, U.S. stocks closed lower amid reports that the Government of China has decided to refrain from large-scale buying of equities in order to boost its domestic equity market. This renewed concerns over the stability of China’s economy. Uncertainty over the interest outlook in the U.S. region also weighed on the market sentiment. Global Indices 31-Aug Prev_Day Abs. Change Dow Jones 16,528 16,643 -115 -0.69 Nasdaq 4,777 4,828 -52 -1.07 FTSE Closed 6,248 NA NA Nikkei 18,890 19,136 -246 -1.28 Hang Seng 21,671 21,612 58 0.27 % Change# Indian Indices 31-Aug Prev_Day Abs. Change S&P BSE Sensex 26,283 26,392 -109 -0.41 CNX Nifty 7,971 8,002 -31 -0.38 CNX 100 8,120 8,154 -34 -0.42 Bank Nifty 17,147 17,212 -65 -0.38 SGX Nifty 7,993 8,029 -36 -0.45 Indian Equity Market S&P BSE Power 1,834 1,863 -29 -1.54 • Indian equity markets fell, after witnessing a brief turnaround, as investors remained concerned over Chinese economic slowdown and possibility of an interest rate hike by the U.S. Federal Reserve towards the end of this year. • Key benchmark indices, S&P BSE Sensex and CNX Nifty, fell 0.41% and 0.38% to close at 26,283.09 and 7,971.30 points, respectively. S&P BSE Mid-Cap and S&P BSE Small-Cap fell 0.23% and 0.20%, respectively. • The overall market breadth on BSE was weak with 1,523 scrips declining and 1,141 scrips advancing. A total of 109 scrips remained unchanged. • On the BSE sectoral front, barring S&P BSE Healthcare, S&P BSE Metal and S&P BSE Oil & Gas, all the indices closed in red. S&P BSE Power was the major laggard, down 1.54%, followed by S&P BSE Realty and S&P BSE Capital Goods, down 1.34% and 1.08%, respectively. Meanwhile, export- led Pharma majors rose on expectations that weakness in the rupee would help boost revenues. S&P BSE Small Cap 10,971 10,993 -22 -0.20 S&P BSE HC 17,962 17,646 316 1.79 P/E Dividend Yield Sensex Nifty Date P/E Div. Yield P/E Div. Yield 31-Aug 20.98 1.40 22.08 1.48 Month Ago 22.38 1.30 23.53 1.41 Year Ago 18.41 1.27 20.80 1.27 Nifty Top 3 Gainers % Change# Company 31-Aug Prev_Day Lupin 1936 1861 4.01 Cipla 682 660 3.38 Dr Reddys Lab 4303 4181 2.92 Nifty Top 3 Losers Domestic News % Change# •India’s Gross Domestic Product grew 7% during the June quarter of FY15-16, slower than 7.5% seen in the previous quarter but slightly faster than 6.7% recorded a year ago. Gross Value Added (GVA) growth stood at 7.1% compared to 7.4% a year ago. Sector wise, manufacturing growth GVA fell to 7.2% in the June quarter compared to 8.4% rise recorded a year ago. Agricultural (including forestry and fishing) growth also slowed down to 1.9% against 2.6% recorded during the similar period. • Core sector output grew by 1.1% (on a yearly basis) in July, much lower than 3% growth seen in the previous month mainly due to contraction in steel production and a slowdown in output of coal and refinery products. The growth of the infrastructure output fell to a three-month low. Steel output fell 2.6% (on a yearly basis) against 4.9% rise in June. The infrastructure sector accounts for nearly 38% of the industrial output. • The Government’s fiscal deficit stood at Rs. 3.85 lakh crore for the four months till July of the current financial year or 69.3% of the annual target that ends in March 2016. It is higher than the deficit of 61.2% for the similar period a year ago. Net tax receipts stood at Rs. 1.54 lakh crore. • According to the Ministry of Finance, India's external debt rose marginally to 23.8% of GDP at the end of March 2015 compared to 23.6% of GDP a year ago. This can be attributed to an increase in external commercial borrowings and NRI deposits. The rise in commercial borrowings is due to an increase in commercial bank loans and securitised borrowing. • Anil Ambani-led Reliance Group has expressed keen interest in playing a larger role in the growing economic ties between India and Qatar by expanding business cooperation with the Gulf country. Company 31-Aug Prev_Day BHEL 226 235 -3.47 Power Grid 131 135 -3.33 Bharti Airtel 354 363 -2.26 Advance Decline Ratio BSE NSE Advances 1141 668 Declines 1523 837 Unchanged 109 68 Institutional Flows (Equity) Inflow/Outflow Description (Cr) YTD 59 FII Flows* 27522 527 MF Flows** 48334 *31st Aug 2015; **28th Aug 2015 Economic Indicator Quarter Ago YoY(%) Current Year Ago -4.05% (Jul-15) 3.80% (Jun-15) -2.43% (Apr-15) 2.50% (Mar-15) 5.41% (Jul-14) 4.30% (Jun-14) WPI IIP 7.50 7.00 (Jun-15) 6.70 GDP (Mar-15) (Jun -14)
Markets for You 01 September 2015 Derivatives Market FII Derivative Trade Statistics 31-Aug • Nifty September 2015 Futures were at 8,000.05 points, a premium of 28.75 points against the spot closing 7,971.30 points. The turnover on NSE’s Futures and Options segment fell from Rs. 1,91,768.35 crore on August 28 to Rs. 1,43,869.18 crore on August 31. • The Put-Call ratio stood at 0.89, compared to the previous session’s close of 0.90. • The Nifty Put-Call ratio stood at 1.03, compared to the previous session’s close of 0.99. • The open interest on Nifty Futures stood at 22.88 million compared to the previous session’s close of 22.57 million. (Rs Cr) Buy Sell Open Int. Index Futures 3859.15 1347.03 18555.22 Index Options 18705.31 15727.00 66190.54 Stock Futures 2710.17 2278.65 43881.61 Stock Options 1800.98 1760.66 932.53 Total 27075.61 21113.34 129559.90 Derivative Statistics- Nifty Options 31-Aug Prev_Day Change Indian Debt Market Put Call Ratio (OI) 1.03 0.99 0.04 • Bond yields changed little amid absence of any fresh trigger although weakness in the rupee continued to weigh on market sentiments. • The yield on the 10-year benchmark bond, 7.72% GS 2025, closed steady at 7.78%, same as the previous session’s close. The paper moved in the range of 7.77% to 7.79% earlier during the trading session. •Banks’ borrowings under the repo window of the Liquidity Adjustment Facility stood at Rs. 5,473 crore (gross) against Rs. 3,914 crore borrowed on August 28. Sale of securities by the RBI under the reverse repo window stood at Rs. 8,331 crore and Rs. 2,947 crore, on August 28 and August 29, respectively. • Banks borrowed Rs. 200 crore under the RBI’s Marginal Standing facility on August 28 compared to Rs. 225 crore borrowed on August 27. Put Call Ratio(Vol) 0.93 0.94 -0.01 Debt Watch 31-Aug Wk. Ago Mth. Ago Year Ago Call Rate 7.13% 7.13% 7.09% 8.24% CBLO 7.16% 7.23% 7.05% 8.16% Repo 7.25% 7.25% 7.25% 8.00% Reverse Repo 6.25% 6.25% 6.25% 7.00% 91 Day T-Bill 7.15% 7.25% 7.30% 8.59% 364 Day T-Bill 7.51% 7.52% 7.57% 8.64% 10 Year Gilt 7.78% 7.89% 7.81% 8.56% Currency Market Update G-Sec Vol. (Rs.Cr) 27972 34726 32118 22193 • The rupee weakened against the dollar amid fall in Chinese equity markets and concerns over a possible rate hike by the U.S. Federal Reserve. The domestic currency declined for the second consecutive day to close at 66.48 per dollar compared to the previous close of 66.14. • The euro strengthened against the dollar, tracking fall in global equity markets. The euro was trading at $1.1225 compared to the previous close of $1.1179. 1 Month CP Rate 7.52% 7.52% 7.53% 8.54% 3 Month CP Rate 7.81% 7.83% 7.91% 9.00% 5 Year Corp Bond 8.36% 8.39% 8.45% 9.35% 1 Month CD Rate 7.29% 7.31% 7.34% 8.28% 3 Month CD Rate 7.49% 7.50% 7.55% 8.76% 1 Year CD Rate 7.83% 7.86% 7.94% 9.09% Currency Market Commodity Market Update • Gold prices fell on renewed concerns over a rate hike by the U.S. Fed in September. The bullion was last seen trading at $1,128.20 per ounce compared to the previous close of $1,133.56 per ounce. • Brent crude prices fell on the back of a supply glut and renewed concerns over China's economic slowdown. Currency 31-Aug Prev_Day Change USD/INR 66.31 66.08 0.23 GBP/INR 102.31 101.92 0.39 International News EURO/INR 74.50 74.37 0.13 • The consumer sentiment index in U.S. was downwardly revised to 91.9 for August, from the preliminary score of 92.9 and lower than 93.1 in July, the University of Michigan report revealed. The downward revision potentially is reflected by the recent sell-off on Wall Street. Both the sub- components, current economic conditions and consumer expectations showed a downward revision although higher fall was due to earlier one. • China's services trade deficit widened to $17.6 billion in July from $14.9 billion in June while merchandise trade showed a surplus of $46 billion in July. For the first seven months of 2015, the services trade shortfall totaled $109.2 billion. JPY/INR 0.55 0.55 0.00 Commodity Prices Currency 31-Aug Wk Ago Mth. Ago Year Ago NYMEX Crude($/bl) 49.20 38.22 47.11 96.44 Brent Crude($/bl) 48.51 41.29 53.64 100.61 Gold( $/oz) 1134 1155 1095 1290 Gold(Rs./10 gm) 26556 27166 24592 27923 Source: ICRON Research Disclaimer: “The information herein is meant only for general reading purposes and contains all factual and statistical information pertaining to Industry and markets which have been obtained from independent third-party sources and which are deemed to be reliable. The information provided cannot be considered as guidelines, recommendations or as a professional guide for the readers. It may be noted that since RCAM has not independently verified the accuracy or authenticity of such information or data, or for that matter the reasonableness of the assumptions upon which such data and information has been processed or arrived at; RCAM does not in any manner assures the accuracy or authenticity of such data and information. Some of the statements & assertions contained in these materials may reflect RCAM’s views or opinions, which in turn may have been formed on the basis of such data or information. The Sponsor, the Investment Manager, the Trustee or any of their respective directors, employees, affiliates or representatives do not assume any responsibility for, or warrant the accuracy, completeness, adequacy and reliability of such data or information. Whilst no action has been solicited based upon the information provided herein, due care has been taken to ensure that the facts are accurate and opinions given are fair and reasonable, to the extent possible. This information is not intended to be an offer or solicitation for the purchase or sale of any financial product or instrument. Recipients of this information should rely on information/data arising out of their own investigations. Before making any investments, the readers are advised to seek independent professional advice, verify the contents in order to arrive at an informed investment decision. None of the Sponsor, the Investment Manager, the Trustee, their respective directors, employees, affiliates or representatives shall be liable in any way for any direct, indirect, special, incidental, consequential, punitive or exemplary damages, including on account of lost profits arising from the information contained in this material. Mutual Fund Investments are subject to market risks, read all scheme related documents carefully.