Download
1 / 35
370 likes | 508 Views
Analysis Techniques. Prof.Dr . Figen KAYA. LECTURE. YOU WIL SELECT A REPRESENTATIVE SOME LECTURE NOTES AND HANDOUTS WILL BE PROVIDED http://www.yarbis.yildiz.edu.tr/fkaya-Duyurular ONE MIDTERM EXAMINATIONS HOMEWORK ASSIGMENTS. RULES. ARRIVE TO CLASS ON TIME

E N D
Analysis Techniques Prof.Dr. Figen KAYA
LECTURE • YOU WIL SELECT A REPRESENTATIVE • SOME LECTURE NOTES AND HANDOUTS WILL BE PROVIDED http://www.yarbis.yildiz.edu.tr/fkaya-Duyurular • ONE MIDTERM EXAMINATIONS • HOMEWORK ASSIGMENTS
RULES • ARRIVE TO CLASS ON TIME • DO NOT READ ANYTHINGELSE (NEWSPAPER) IN CLASS • MOBILE PHONES • ASK QUESTIONS IN ENGLISH
Course Materials • ASM Handbook Volume 10 MaterialsCharacterization, ISBN 0-87170-007-7 • MaterialsCharacterization; An IntroductiontoMicroscopicandSpecroscopicMethods, Y.Leng, Wiley Publishing ISBN 978-0-470-82298-2 • Chemical Analysis, Modern Instrumentation MethodsandTechniques, F.Rouessac, A.Rouessac, Wiley Publishing, ISBN 978-0-470-85903-2 • Principles of Instrumental Analysis, D.A.Skoog, F.J.Holler, T.A.Nieman, SaundersCollege Publishing. ISBN0-03-002078-6 • QuantitativeChemical Analysis, D.C.Harris. W.H.FreemanandCompany ISBN:0-7167-4464-3
What is Analysis? Analysis: Whataretheconstituents of thesample? Analyticalchemistrydealswithmethodsfordeterminingthechemicalcomposition of samples of matter. Analysis could be classifyintotwocategories: 1- QualitativeMethods 2- QuantitativeMethods • Constituent: Acomponent part of something(i.e. Composite, cpompound, mixtureetc.) • Hot water • Coffeegranules • Sugar • Milk • Cream • Cacaopowder
Qualitative Analysis: The aim of qualitative analysis is a complete, detailed description. Qualitativemethodyieldinformationabouttheidentitiy of atomicormolecularspeciesorthefunctionalgroups in thesample. →Which atom/atoms, molecule/moleculesarecomingtogether in themakeup of thesample? Group= Greentokens (pieces)+ Yellowtokens+ Blue tokens+ Redtokens
QuantitativeAnalysis QuantitativeAnalysis; we classify features, count them, and even construct more complex statistical models in an attempt to explain what is observed. Quantitativemethodprovidesnumericalinformation as totherelativeamount of oneormore of thesecompanents. →How many/ how muchgrams? volumes? of atom/atomsormolecule/molecules in thesample • Group= 6 Greentokens (pieces)+ • 8 Yellowtokens+ • 6 Blue tokens+ • 10 Redtokens
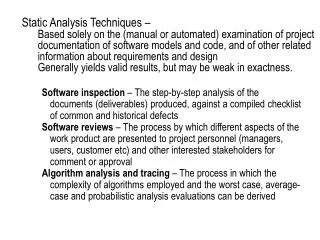
Classification of AnalyticalMethods 1- ClassicalMethods (WetChemicalMethods): Theanalysesarecarriedoutbyseperatingthecomponents of interest (analytes) in a sampleby; *Precipitation, *Extraction*Distillation. Forqualitativeanalses, theseperatedcomponentsaretreatedwithreagentsthatyieldedproductsthatcould be recognisedby; →theircolors, → theirboilingormeltingpoints, → theirsolubilities in a series of solvents, →theirodors, →theiropticalactivities, →theirreactiveindexes
Reagent: A substance or compound that is added to a system in order to bring about a chemical reaction, or added to see if a reaction occurs. Reagent: Cobalt(II)thiocyanate C2CoN2S2→ Red Afterreactionwithcocaine → turnstoBlue
Blue litmus paper turns red under acidic conditions and red litmus paper turns blue under basic (i.e. alkaline) conditions. • hydroxyphenoxazone
Forquantitativeanalyses, theamount of analyte is determinedbygravimetricorbytitrimetricmeasurements. • Gravimetricmeasurement: themass of theanalyte is determined. • Titrimetricmeasurement: Thevolumeormass of a standart reagentrequiredtoreactcompletelywiththeanalyte is measured.
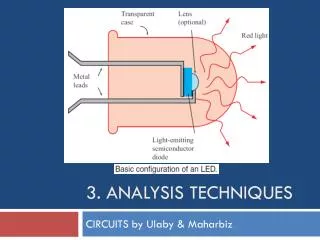
InstrumentalMethods: Use of physicalproperties of analytessuch as; →Conductivity →electrodepotential →lightabsorptionoremission →flourescencetoanalysequantitativeanalysis of samples. Seperatinganddeterminingchemicalmakeup of a samplebymachinesanddevices.
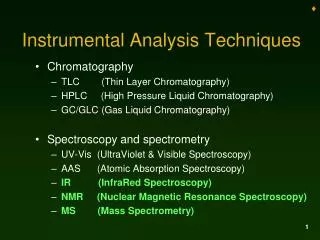
InstrumentalMethods: InstrumentalMethodscould be classifyinto 4 differentgroups: 1) SpectroscopicMethods 2)ElectrochemicalMethods 3) CromotographicMethods 4) ThermalMethods
Spectroscopy • What Is Spectroscopy?Spectroscopy is a technique that uses the interaction of energy with a sample to perform an analysis. Studying the properties of matter through its interaction with different frequencycomponents of the electromagnetic spectrum. Latin: “spectron”—ghost or spirit Greek: “ σκοπειν ”—tosee
Spectrum With light, you aren’t looking directly at the molecule—the matter—but its“ghost.” You observe the light’s interaction with different degrees of freedom ofthe molecule. Each type of spectroscopy—different light frequency—gives adifferentpicture X Rays → XRD spectrum. UV light → UV spectrum IR (InfraRed) light → IR-Raman spectrum
Electromagnetic wave (radiation) is an energy form that may be propagated through space and may interact with atoms and molecules to alter their energy state.
What is a Spectrum?The data that is obtained from spectroscopy is called a spectrum. A spectrum is a plot of the intensity of energy detected versus the wavelength (or mass or momentum or frequency, etc.) of the energy.
Goals: • Understand how light interacts with matter and how you can use this toquantitativelyunderstandyoursample. • Understand spectroscopy the way you understand other common tools ofmeasurement like the watch or the ruler. • See that spectroscopy is a set of tools that you can put together in different waysto understand systems → solve chemical problems.
The immediate questions that we want to address are: • Whatdoes light do to sample? • How do you produce a spectrum? • What EXACTLY is a spectrum a measurement of?
What does a spectrum measure? Interaction of light with a sample can influence the sample and/or the light. Method involves: (1) excitation and (2) detection.
Excitation: The activity produced inanysystem that is caused by stimulation.
In most spectroscopies, we characterize how a sample modifies lightenteringit. 1) Absorption: Change in intensity I of incident light Sampleattenuateslight → transmissionT=I/I0
Absorption: • We measure the absorption of light at different frequency or wavelength.
2) Emission: Excitation induces emission of light from the sample Includes: • Fluorescence (emission from excited electronic singlet states) • Phosphorescence (emission from excited electronic triplet states) • Raman Scattering (light scattering involving vibrational transition)(usually ofdifferentfrequency).
3) Optical Rotation: Change of phase of light incident on sample (rotation ofpolarization)
What Are Types of Spectroscopy? There are as many different types of spectroscopy as there are energy sources! Here are some examples: • Atomic (Optical) EmissionSpectroscopy • AtomicAbsorption Spectroscopy • InductivelyCoupledPlasmaAtomicEmissionSpectroscopy • UV- VisibleAbsorptionSpectroscopy • Infra-RedSpectroscopy (IR/FT-IR) • Raman Spectroscopy • X Ray Diffraction • X Ray Flourescencespectrometry • Massspectrometry • X-ray photoelectron spectroscopy (XPS) • Auger electron spectroscopy (AES),
Whataretheaxes? X-axis: Characterizes the input light in terms of frequency-wavelength-energy • Wavelengthλ (nm, μm, Å), • Frequency ν (cycles/sec or s-1 or Hz) • Energy (expressed as eV or as cm-1) E = hν λ→Wavelength υ→frequency c →Speed of light
Y-axis: Absorption = (Beer’sLaw) I0 = light intensity incident on the sample I = light intensity after the sample ε = molardecadicextinctioncoefficient (M−1cm−1 ) – absorptioncoefficient c = concentration (M) L = samplelength (cm)
Electromagnetic wave (radiation)is an energy form that may be propagated through space and may interact with atoms and molecules to alter their energy state.
What Information Is Obtained? A spectrum can be used to obtain information on; →atomic and molecular energy levels, → molecular geometries, → chemical bonds, → interactions of molecules, and related processes. Often, spectra are used to identify the components of a sample (qualitative analysis). Spectra may also be used to measure the amount of material in a sample (quantitative analysis).
What Instruments Are Needed? There are several instruments that are used to perform a spectroscopic analysis. In simplest terms, spectroscopy requires; →An energy source (commonly a laser, but this could be an ion source or radiation source) and
What Instruments Are Needed? → A device for measuring the change in the energy source after it has interacted with the sample (often a spectrophotometer or interferometer). Dedector: