Download
1 / 26
260 likes | 266 Views
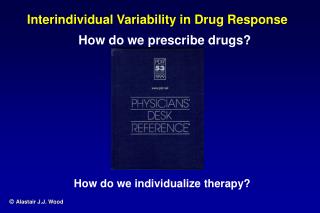
Backgrounds and Thresholds in Non-Cancer Dose-Response: Implications for Low-Dose Risk Lorenz Rhomberg, PhD ATS Gradient. Beyond “Science and Decisions”: From Issue Identification to Dose-Response Assessment Austin, TX 16 March 2010. White et al. 2009 EHP 117(2):283

E N D
Backgrounds and Thresholds in Non-Cancer Dose-Response: Implications for Low-Dose RiskLorenz Rhomberg, PhD ATSGradient Beyond “Science and Decisions”: From Issue Identification to Dose-Response Assessment Austin, TX 16 March 2010
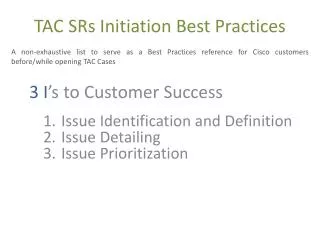
White et al. 2009 EHP 117(2):283 Science and Decisions – Chapter 5 • THREE LINES OF ARGUMENT: • Additivity to Background Processes that Produce Background Disease; • Heterogeneity in Sensitivity Among Humans; • Observed Linearity of Noncancer Effects in Epi Studies (of Criteria Pollutants)
Exposure Misclassification in Epidemiology Biases Toward Flat Dose-Response and Obscures True Thresholds Brauer et al. 2002 Risk Anal 22(6):1183
Heterogeneity Leads to a Lognormal Distribution, Not Low-Dose Linearity Lutz WK. 1990. Carcinogenesis 11(8):1243
BIOLOGICAL ARGUMENTS (for thresholds) MODELING ARGUMENTS (for additivity-to-background and low-dose linearity)
Individual Fate vs. Collective Function Higher Level Need Collective Function repair R D U N A N C Y E D
Defenses • Reduce Impact (mostly molecular) • Detoxification and clearance • Alternative targets • Tolerate Impact (mostly cellular & organ/system) • Excess Capacity • Redundancy • Counteract Impact (mostly cellular & organ/system) • Homeostasis • Compensation • Repair Damage (DNA)
Pathophysiological Progression Figure 1. Pathogenesis of fibrosis from the tissue perspective.
Population Distribution of Internal State REL FREQ Value of Key Internal Variable
Some % Beyond Threshold – Leading to a Background Rate of Disease REL FREQ Value of Key Internal Variable
Even a Small Shift in Distribution of Internal State Leads to Greater % Beyond Threshold REL FREQ Value of Key Internal Variable
What Biological Assumptions Does Such Additivity-to-BG Implicitly Make? … and how do they match up with our observations and understanding of non-cancer toxicity? REL FREQ Value of Key Internal Variable
What Biological Assumptions Does Such Additivity-to-BG Implicitly Make? (1) Background Disease is the same as adverse effects observed at high dose REL FREQ Value of Key Internal Variable
What Biological Assumptions Does Such Additivity-to-BG Implicitly Make? • (2) BG Disease exists in the target population • it is their background that is being added to REL FREQ Value of Key Internal Variable
What Biological Assumptions Does Such Additivity-to-BG Implicitly Make? (3) Extreme value of internal variable is sufficient to cause/enable BG disease REL FREQ Value of Key Internal Variable
What Biological Assumptions Does Such Additivity-to-BG Implicitly Make? • (4) Continuous distribution of underlying key internal factor • not a distinct sub-population with other causes • broad continuity between “normal” and “abnormal” ranges REL FREQ Value of Key Internal Variable
What Biological Assumptions Does Such Additivity-to-BG Implicitly Make? • (5) Small doses do indeed shift the distribution • ie, the effect on the internal variable is assumed to be linear/no-threshold! REL FREQ Value of Key Internal Variable
The OTHER tail! … with a shift in distribution, fewer individuals are in the extreme of the tail one is moving away from! REL FREQ Value of Key Internal Variable
EP = BG BG in Humans Threshold within Existing Variation Continuity of Mainstream and Affected Small Doses Shift Distribution Are usual IRIS endpoints observed as (uncommon) occurrences in natural populations? What human disease states are equivalent to animal endpoints?
EP = BG BG in Humans Threshold within Existing Variation Continuity of Mainstream and Affected Small Doses Shift Distribution What human disease states are equivalent to animal endpoints? How common? Is the MoA for background human disease the same as high-dose animal adverse effects?
EP = BG BG in Humans Threshold within Existing Variation Continuity of Mainstream and Affected Small Doses Shift Distribution MoA? How does just crossing the threshold precipitate disease? What is biologically necessary? Sufficient? Is it unhealthy merely to be on the edges of normal variation?
EP = BG BG in Humans Threshold within Existing Variation Continuity of Mainstream and Affected Small Doses Shift Distribution Is there a gradual gradation between normal and abnormal states? How does this gibe with our notions of “healthy” “normal” and “disease” as distinct states? In view of pathophysiological progression of toxicity, what evidence for widespread intermediate states?
EP = BG BG in Humans Threshold within Existing Variation Continuity of Mainstream and Affected Small Doses Shift Distribution Why does the dose shift the distribution in a linear/no-threshold way? Are we just assuming linearity at a lower level of biological organization? Role of homeostasis, control processes, and defenses?
Two Views of the Living System • Delicate balance • Toxicity is falling off the edge of normal, and normal goes to the edge • Robust, self-controlling in the face of environmental fluctuations • Toxicity is a cascade of failures of control processes pushed too far
Questions • How do “biological” and “modeling” views and their conceptions of underlying process match up? • How general is an additivity to background issue expected to be? What would need to be shown? • How should our vast experience with apparently threshold toxicity enter the discussion?