Download
1 / 3
30 likes | 93 Views
Supplementary Figure 1. Quantitative (metabolites). Qualitative (spectra). PCA of samples using qualitative (spectral) and quantitative (metabolite concentration) data presented using PC1 and PC2 values. The grouping of sample subtypes is identical. Supplementary Figure 2. LN229 LN319. LN18

E N D
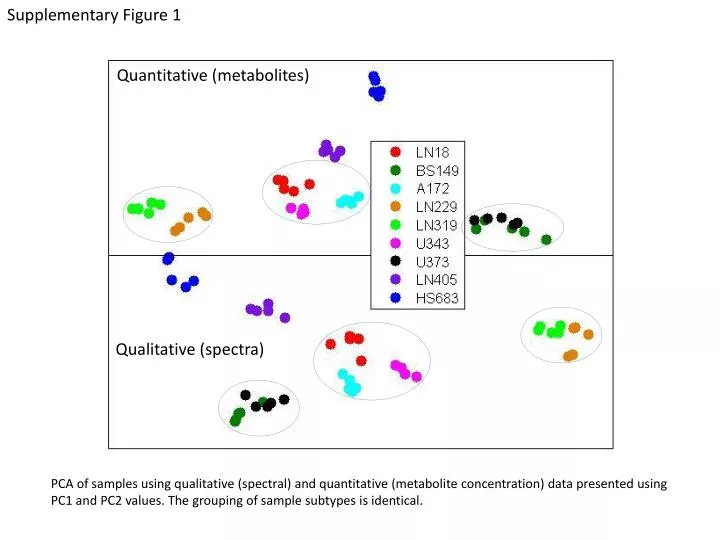
Supplementary Figure 1 Quantitative (metabolites) Qualitative (spectra) PCA of samples using qualitative (spectral) and quantitative (metabolite concentration) data presented using PC1 and PC2 values. The grouping of sample subtypes is identical.
Supplementary Figure 2 LN229 LN319 LN18 A172 U343 LN18 A172 U343 U373 BS149 LN229 LN319 U373 BS149 Quantitative (metabolites) Qualitative (spectra) PCA of samples using qualitative (spectral) and quantitative (metabolite concentration) data presented using PC1, PC2 and PC3 values. The grouping of sample subtypes is identical.
Supplementary Figure 3 Quantitative (metabolites) Qualitative (spectra) LN229 U343 A172 LN18 LN319 HS683 U373 LN405 BS149 Fuzzy K-means clustering of samples using qualitative (spectral) and quantitative (metabolite concentration) data. Number of clusters used is 4 and the fuzzification parameter m=2. The grouping of sample subtypes is identical both with the top and other memberships to clusters.