Download
1 / 25
360 likes | 1.06k Views
Metabolomics: The quantitative analysis of endogenous metabolites in biological samples. Minimally invasive, preclinical and clinical evaluation of biofluids Monitor predisposition, onset, duration, severity, and recovery in individuals Simultaneous detection of multitude of metabolites

E N D
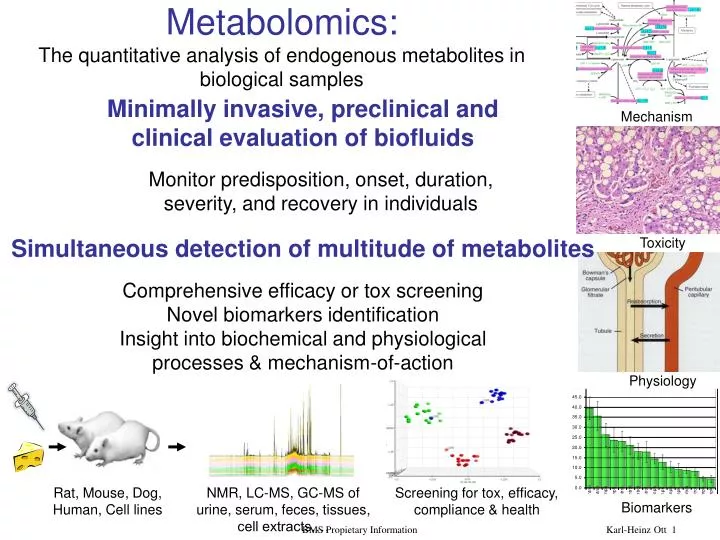
Metabolomics: The quantitative analysis of endogenous metabolites in biological samples • Minimally invasive, preclinical and clinical evaluation of biofluids • Monitor predisposition, onset, duration, severity, and recovery in individuals • Simultaneous detection of multitude of metabolites • Comprehensive efficacy or tox screening Novel biomarkers identificationInsight into biochemical and physiological processes & mechanism-of-action Mechanism Toxicity Physiology Rat, Mouse, Dog, Human, Cell lines NMR, LC-MS, GC-MS of urine, serum, feces, tissues, cell extracts,… Screening for tox, efficacy, compliance & health Biomarkers BMS Propietary Information
Toxin-induced CholestasisIntegrated Metabonomics and Transcriptomics for Hypothesis Generation and Mechanistic Studies Advanvces in Metabolic Profiling, Boston, Nov 13-15 Karl-Heinz Ott, Nelly Aranibar, Petia Shipkova, Serhiy Hnatyshyn, Mark Sanders, Steven Stryker , Brian Gemzik, Evan Janovitz, Bo Wen, Christine Huang, Wenjun Wang, Aiqing He Bristol-Myers Squibb Nov 2007 BMS Propietary Information
Histopathology of bile duct @ day 10 Hyperplastic bile duct epithelium Fibroplasia Normal bile duct Plug from bile duct Eroded bile duct epithelium Inflammatory cell infiltrate Toxin 1 30 mg/kg/day x 10 days Serum Bilirubin = 0.19 mg/dL Compound 2 30 mg/kg/day x 10 days Serum Bilirubin < 0.10 mg/dL Drug effect on bile duct ephithelium? BMS Propietary Information E. Janovitz
3 P 1 Control 3 P 1 10mpk 3 P 1 For Bile Acids For Bile Acids 30mpk Screening Screening LC-MS LC-MS Amino Acids Amino Acids CPMG 2D-JRES NMR NOEGP Deproteinize NOEGP 8 8 8 16 16 16 24 24 24 Study Design NMR Serum, and urine metabolomics evaluated by NMR and MS and Liver tissue expression profiling on 5 animals/group. Bile metabolom analyzed in second batch with 4 animals/group Exposure in plasma, tissue and bile (PK), histopathology and clinical chemistry endpoints evaluated for both batches. NMR LC/MS Transcriptomics BMS Propietary Information
Deoxycholate Deoxycholate Taurocholate Taurocholate Taurocholate Glycocholate Glycocholate Cholic acid increased at day 1 and day 3 at 10mg/kg and at 30 mg/kg. Cholate Cholate Cholate Strong increase in taurocholic acids at day 3 Serum Bile Acids in Rats Treated with Toxin 1 30 mpk/Day3 10 mpk/Day1 10 mpk/Day3 30 mpk/Day1 Steven Stryker, Brian Gemzik (DT), Petia Shipkova, Nelly Aranibar, Mark Sanders (BDAS) and Karl-Heinz Ott (AG) BMS Propietary Information
Timing of marker changes and spectrum of serum bile acid changes indicate that bile acid biosynthesis is not likely mechanistic cause of observed cholestasis BMS Propietary Information
Source: Liposcience NMR: Lipid and lipoprotein serum profile changes from LDL to HDL are highly significant upon treatment: -CH2 -CH3 Red: High Dose Blue: Control BMS Propietary Information
NMR Aromatic Region: aromatic amino acids response in intact serum BMS Propietary Information
TSP internal standard shift and broadening: a measure of hydrophobic protein binding Red trace: high dose 3-day, TSP is less bound to protein and/or in fast exchange between free and bound states Blue trace: control, two protein-bound TSP populations in slow exchange with one another Binding, availability, and transport of hydrophobic molecules in the serum are altered, probably due to high bile acid concentrations on serum. BMS Propietary Information
Control 10mpk 30 mpk Signature Profile Value Time Time Time Urine Metabolom • Time-resolved PLS analysis indicated a dose response curve of the metabolite profiles. The magnitude of the metabolite changes underlying the profiles were considered to small to serve as a robust screening tools for a discovery program. Nelly Aranibar (BDAS) and Karl-Heinz Ott (AG) BMS Propietary Information
Animal 3101 PCA of Urine NMR data • Animal 3101 has altered metabolism (starting pre-dose) (along PC2) • #3101, 3103, 3105 have more pronounced alteration than 3102, 3104 • “Day” and “Time” have an effect that is similar in nature (i.e. along PC1) to possible “Dose” effect BMS Propietary Information
Plasma exposure data in Study 1 • Low exposure in Low dose • High, but individually different exposure in High dose group • 3103 and 3104 have lower exposure • 3101 has altered metabolism, consistent with data from predose and day 1 urine metabolomics BMS Propietary Information
Analysis of all metabolomics data in the context of exposure data Clustered list of ~ 600 U & S Metabolite Measures Red: Pos. correlated, green: negative correlated, black: uncorrelated Drug Meta-bolites Day Dose BMS Propietary Information
Serum and urine metabolites correlate closely with exposure BMS Propietary Information
A highly significant urinary biomarker is associated with treatment, time and toxicity High dose Control BMS Propietary Information
control HD, d3 TR- Cannalicular transporters implied? Three highly significant urinary markers match a metabolite previously discovered and unique to TR- rats urine • TR- is a spontaneous mutation that impairs the cannalicular multispecific organic anion transporter (an ABC transporter aka. Multidrug-resistance associated protein, Mrp-2). • Mrp2 transports [xenobiotica-] glucuronides, bilirubin (TR- are hyperbilirubinemic), and GSH complexes into bile BMS Propietary Information
NMR metabonomics analysis of Bile Local Pearson Correlation • 6h-8h bile composition differs most prominently from other time intervals, regardless of treatmentAnimal 1103 (injured) and 2101 (exposure/drug metabolism?) reflected as outlier Control bile composition:22h-24h Predose differs from matching day1 and day3 collections.Only small differences between 2h-4h and 22h-24h BMS Propietary Information
Average bile flow changes during 24h intervals Red: Control Black: 30mpk N=4 for all control intervals Mean Flow = 2.0 ml/2h Mean Flow at 8h high dose: 1.1 ml/2h Mean Flow at 8h vehicle: 1.7 ml/2h Animals adapted to a restricted feeding regimen showed a significant increase of bile flow and of biliary bile salt and cholesterol excretion during feeding (10AM-3 PM); these parameters reached their maximum 3 hours after onset of food intake. J. Lipid Res. Weis and Barth 19 (7): 856 BMS Propietary Information
Bile at different time periods, std. scaling • Relative amount of signals in upfield and downfield region differs. • Signature of bile acids is altered between 6-8h and 22-24h. Blue : 6h-8h Black : 22h-24h Spectra scaled to total integral (~ integral over 4—1ppm) BMS Propietary Information
Bile at different time periods (rescaled) • Decrease of bile acids at 6-8h vs 22-24h. • Relative little change in aromatic portion between time periods. Downfield region Upfield region Black: 6h-8h Blue: 22h-24h TSP(8h) ~ TSP(24h) Spectra scaled to left portion (10-6ppm) BMS Propietary Information
Aliphatic (bile acid signal) region at 6h-8h Minimal changes upon treatment Some alterationin bile acid composition Control Day1,Day3 High dose Day1,Day3 BMS Propietary Information
Aromatic region at 6-8h shows marked differences upon treatment controls High dose day 1 High dose day 3 BMS Propietary Information
Control day 1 Control day 3 High dose day 1 High dose day 3 Changes in aromatic region are observable immediately: 2-4h after dose, day 1 BMS Propietary Information
Marker associated to Mrp2 transporter disappears from bile at high dose treatment • Marker appeared in urine spectra after treatment, but not in controls • Marker is “recovering” in animal 2101 at Day3 24h Control day 1 Control day 3 High dose day 1 22h-24h NMR spectra are shown High dose day 3 BMS Propietary Information
Fold Change Treated vs Control for selected transporters Liver Expression Profiling The analysis of the expression data focused on CYPs and hepatocyte transporters that indicated: • MRP3: Highly up-regulated upon treatment at day 3 (T1) and day 7 (T2) • Basolateral Transporters: Sodium/bile acid co-transporter and other solute carrier anion transporters are predominantly down-regulated. Several other ABC transporters also downregulated. • Cannalicular Transporters: MRP2 slightly upregulated; MRP1: downregulated; BSEP: ~ Constant. • Pathway analysis did not show significant pathway associations except for pathways involving CYPs. CYPs: 3 up, 14 down (in 3day study), • Cholesterol biosynthesis pathways are affected via altered CYP expression, but Cyp expression often different in T1/3day and T2/7day studies. • (Non-CYP) genes involved in regulating bile production and transport were only sporadically found to be significantly altered. • Inflammatory pathways were not indicated as affected. BMS Propietary Information Karl-Heinz Ott, Wenjun Wang, Aiqing He (AG) and Nelly Aranibar (BDAS)