Download
1 / 22
220 likes | 580 Views
Chapter 7: Inference for Distributions. http://www.xkcd.com/892/. Shape of t-distribution. http://upload.wikimedia.org/wikipedia/commons/thumb/4/41/Student_t_pdf.svg/1000px-Student_t_pdf.svg.png. t-Table (Table D). Summary: CI. Example: Sample size.

E N D
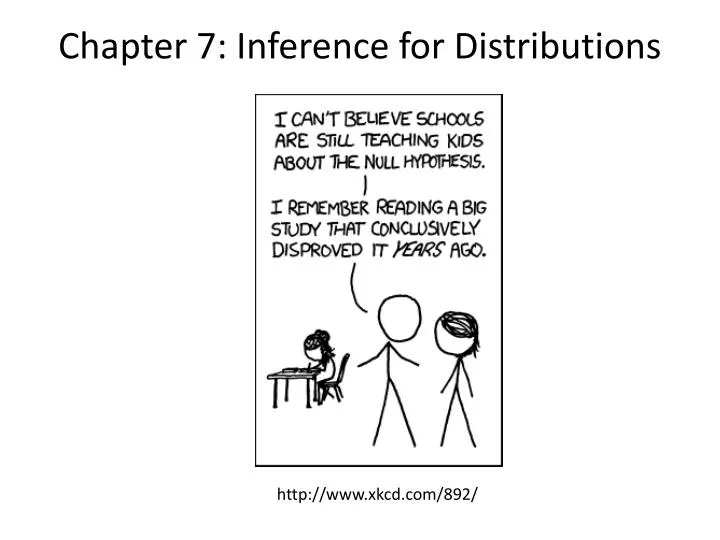
Chapter 7: Inference for Distributions http://www.xkcd.com/892/
Shape of t-distribution http://upload.wikimedia.org/wikipedia/commons/thumb/4/41/Student_t_pdf.svg/1000px-Student_t_pdf.svg.png
Example: Sample size You are in charge of quality control in your food company. You sample randomly four packs of cherry tomatoes. The average weight from your four boxes is 222 g with a sample standard deviation of 5 g. a) What sample size is required to obtain a margin of error of 2 g at a 95% confidence level?
Single mean test: Summary Null hypothesis: H0: μ = μ0 Test statistic:
Two-sample Test (independent): Summary Null hypothesis: H0: μ1 – μ2 = Δ Test statistic: Note: If we are determining if the two populations are equal, then Δ = 0
Example: two-sample Independent t A group of 15 college seniors are selected to participate in a manual dexterity skill test against a group of 20 industrial workers. Skills are assessed by scores obtained on a test taken by both groups. The data is shown in the following table: a) Perform a significance test to determine if the skills are the same for college students and industrial works at a significance level of 0.05. b) Calculate and interpret the 95% confidence interval.
Example: two-sample Independent t (cont) The data does not provide strong support (P = 0.128) to the claim that there is a difference between the population mean tests for students and workers. We are 95% confidence that the difference between the population mean tests of students and workers is between -5.08 and 0.68.
Example: Paired t test Procedure In an effort to determine whether sensitivity training for nurses would improve the quality of nursing provided at an area hospital, the following study was conducted. Eight different nurses were selected and their nursing skills were given a score from 1 to 10. After this initial screening, a training program was administered, and then the same nurses were rated again. On the next slide is a table of their pre- and post-training scores. a) Conduct a test to determine whether the training could on average improve the quality of nursing provided in the population at a 0.01 significance level. b) Calculate and interpret the 99% lower confidence bound of the population mean difference in nursing scores?
Example: Paired t test Procedure (cont) The data does provide strong support (P = 0.002) to the claim that the population average training score did improve after training. We are 99% confident that the difference in the scores between pre-training and post-training scores is less than -0.39.
Independent vs. Paired 1. If there is great heterogeneity between experimental units and a large correlation within experimental units then a paired experiment is preferable. 2. If the experimental units are relatively homogeneous and the correlation within pairs is not large, then unpaired experiments should be used
In Class (or HW): 2-sample Independent or Paired For the following questions In Chapter 7 review exercises, state which method is better; independent or paired and why. The following explanations are wrong: 1) there is no information for one of the methods, 2) the data is matched in the exercise, 3) the number of data points is different (or the same). Please look at the following slides for the questions so you are not influenced by how the data is presented: 7.118, 7.119, 7.122, 7.127, 7.128, 7.132, 7.136
7.118 7.118Does dress affect competence and intelligence ratings? Researchers performed a study to examine whether or not women are perceived as less competent and less intelligent when they dress in a sexy manner versus a business-like manner. Competence was rated from 1 (not at all) to 7 (extremely), and a 1 to 5 scale was used for intelligence. Under each condition, 17 subjects provided data.
7.119 7.119Perceived quality of high- and low-performing restaurants. A study classified 394 quick-service restaurants (QSR) into high-performing and low-performing groups based on their total sales. Each restaurant was rated on a collection of perceived measures of quality by a large number of diners using a 1 to 7 scale. In this study we view the diners as a measuring instrument, and our major interest is in comparing the 170 high-sales restaurants with the 224 low-sales restaurants.
7.122 7.122Air in poultry-processing plants. The air in poultry-processing plants often contains fungus spores. If the ventilation is inadequate, this can affect the health of the workers. The problem is most serious during the summer. To measure the presence of spores, air samples are pumped to an agar plate and “colony-forming units (CFUs)” are counted after an incubation period. Here are data from two locations in a plant that processes 37,000 turkeys per day, taken on four days in the summer.
7.127 7.127The manufacture of dyed clothing fabrics. Different fabrics respond differently when dyed. This matters to clothing manufacturers, who want the color of the fabric to be just right. Fabrics made of cotton and of ramie are dyed with the same “procion blue” die applied in the same way. A colorimeter is used to measure the lightness of the color on a scale in which black is 0 and white is 100.
7.128 7.128Durable press and breaking strength. “Durable press” cotton fabrics are treated to improve their recovery from wrinkles after washing. Unfortunately, the treatment also reduces the strength of the fabric. A study compared the breaking strength of fabric treated by two commercial durable press processes. Five specimens of the same fabric were assigned at random to each process.
7.132 7.132Brain training. The assessment of computerized brain-training programs is a rapidly growing area of research. Researchers are now focusing on who this training benefits most, what brain functions are most susceptible to improvement, and which products are most effective. A recent study looked at 487 community-dwelling adults aged 65 and older, each randomly assigned to one of two training groups. In one group, the participants used a computerized program 1 hour per day. In the other, DVD-based educational programs were shown and quizzes were administered after each video. The training period lasted 8 weeks. The response was the improvement in a composite score obtained from an auditory memory/attention survey given before and after the 8 weeks.
7.136 7.136Occupation and diet. Do various occupational groups differ in their diets? A British study of this question compared 98 drivers and 83 conductors of London double-decker buses. The conductors’ jobs require more physical activity.