Download
1 / 139
1.42k likes | 1.65k Views
Chapter 6 Probability Distributions. Learn …. To analyze how likely it is that sample results will be “close” to population values How probability provides the basis for making statistical inferences. Inferential Statistics.

E N D
Chapter 6Probability Distributions • Learn …. To analyze how likely it is that sample results will be “close” to population values How probability provides the basis for making statistical inferences
Inferential Statistics • Use sample data to make decisions and predictions about a population
Section 6.1 How Can We Summarize Possible Outcomes and Their Probabilities?
Randomness • The numerical values that a variable assumes are the result of some random phenomenon: • Selecting a random sample for a population or • Performing a randomized experiment
Random Variable • A random variable is a numerical measurement of the outcome of a random phenomenon.
Random Variable • Use letters near the end of the alphabet, such as x, to symbolize variables. • Use a capital letter, such as X, to refer to the random variable itself. • Use a small letter, such as x, to refer to a particular value of the variable.
Probability Distribution • The probability distribution of a random variable specifies its possible values and their probabilities.
Discrete Random Variable • The possible outcomes are a set of separate numbers: (0, 1,2, …).
Probability Distribution of a Discrete Random Variable • A discrete random variable X takes a set of separate values (such as 0,1,2,…) • Its probability distribution assigns a probability P(x) to each possible value x: • For each x, the probability P(x) falls between 0 and 1 • The sum of the probabilities for all the possible x values equals 1
Example: How many Home Runs Will the Red Sox Hit in a Game? • What is the estimated probability of at least three home runs?
Parameters of a Probability Distribution • Parameters: numerical summaries of a probability distribution.
The Mean of a Probability Distribution • The mean of a probability distribution is denoted by the parameter, µ.
The Mean of a Discrete Probability Distribution • The mean of a probability distribution for a discrete random variable is where the sum is taken over all possible values of x.
Expected Value of X • The mean of a probability distribution of a random variable X is also called the expected value of X. • The expected value reflects not what we’ll observe in a single observation, but rather that we expect for the average in a long run of observations.
Example: What’s the Expected Number of Home Runs in a Baseball Game? • Find the mean of this probability distribution.
Example: What’s the Expected Number of Home Runs in a Baseball Game? • The mean: = 0(0.23) + 1(0.38) + 2(0.22) + 3(0.13) + 4(0.03) + 5(0.01) = 1.38
The Standard Deviation of a Probability Distribution • The standard deviation of a probability distribution, denoted by the parameter, σ, measures its spread. • Larger values of σ correspond to greater spread.
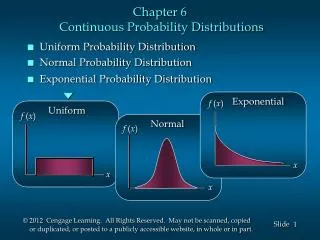
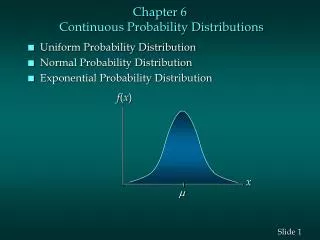
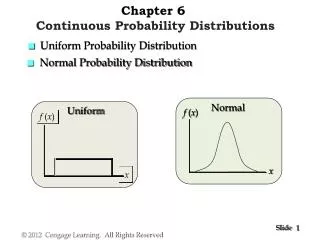
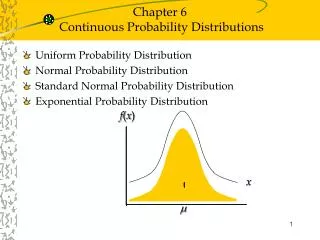
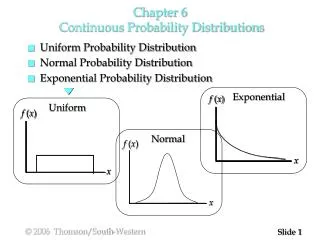
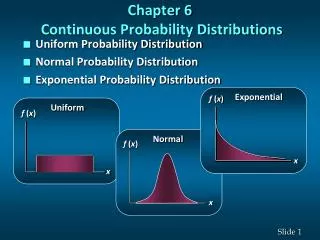
Continuous Random Variable • A continuous random variable has an infinite continuum of possible values in an interval. • Examples are: time, age and size measures such as height and weight.
Probability Distribution of a Continuous Random Variable • A continuous random variable has possible values that from an interval. • Its probability distribution is specified by a curve. • Each interval has probability between 0 and 1. • The interval containing all possible values has probability equal to 1.
Continuous Variables are Measured in a Discrete Manner because of Rounding.
Which Wager do You Prefer? • You are given $100 and told that you must pick one of two wagers, for an outcome based on flipping a coin: A. You win $200 if it comes up heads and lose $50 if it comes up tails. B. You win $350 if it comes up head and lose your original $100 if it comes up tails. • Without doing any calculation, which wager would you prefer?
You win $200 if it comes up heads and lose $50 if it comes up tails. Find the expected outcome for this wager. • $100 • $25 • $50 • $75
You win $350 if it comes up head and lose your original $100 if it comes up tails. Find the expected outcome for this wager. • $100 • $125 • $350 • $275
Section 6.2 How Can We Find Probabilities for Bell-Shaped Distributions?
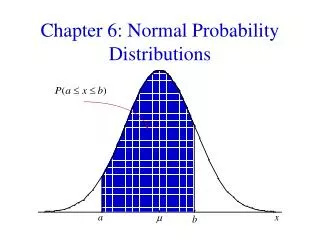
Normal Distribution • The normal distribution is symmetric, bell-shaped and characterized by its mean µ and standard deviationσ. • The probability of falling within any particular number of standard deviations of µ is the same for all normal distributions.
Z-Score • Recall: The z-score for an observation is the number of standard deviations that it falls from the mean.
Z-Score • For each fixed number z, the probability within z standard deviations of the mean is the area under the normal curve between
Z-Score • For z = 1: 68% of the area (probability) of a normal distribution falls between:
Z-Score • For z = 2: 95% of the area (probability) of a normal distribution falls between:
Z-Score • For z = 3: Nearly 100% of the area (probability) of a normal distribution falls between:
The Normal Distribution: The Most Important One in Statistics • It’s important because… • Many variables have approximate normal distributions. • It’s used to approximate many discrete distributions. • Many statistical methods use the normal distribution even when the data are not bell-shaped.
Finding Normal Probabilities for Various Z-values • Suppose we wish to find the probability within, say, 1.43 standard deviations of µ.
Z-Scores and the Standard Normal Distribution • When a random variable has a normal distribution and its values are converted to z-scores by subtracting the mean and dividing by the standard deviation, the z-scores have the standard normal distribution.
Example: Find the probability within 1.43 standard deviations of µ
Example: Find the probability within 1.43 standard deviations of µ • Probability below 1.43σ = .9236 • Probability above 1.43σ = .0764 • By symmetry, probability below -1.43σ = .0764 • Total probability under the curve = 1
Example: Find the probability within 1.43 standard deviations of µ
Example: Find the probability within 1.43 standard deviations of µ • The probability falling within 1.43 standard deviations of the mean equals: 1 – 0.1528 = 0.8472, about 85%
How Can We Find the Value of z for a Certain Cumulative Probability? • Example: Find the value of z for a cumulative probability of 0.025.
Example: Find the Value of z For a Cumulative Probability of 0.025 Example: Find the Value of z For a Cumulative Probability of 0.025 • Look up the cumulative probability of 0.025 in the body of Table A. • A cumulative probability of 0.025 corresponds to z = -1.96. • So, a probability of 0.025 lies below µ - 1.96σ.
Example: Find the Value of z For a Cumulative Probability of 0.025
Example: What IQ Do You Need to Get Into Mensa? • Mensa is a society of high-IQ people whose members have a score on an IQ test at the 98th percentile or higher.
Example: What IQ Do You Need to Get Into Mensa? • How many standard deviations above the mean is the 98th percentile? • The cumulative probability of 0.980 in the body of Table A corresponds to z = 2.05. • The 98th percentile is 2.05 standard deviations above µ.
Example: What IQ Do You Need to Get Into Mensa? • What is the IQ for that percentile? • Since µ = 100 and σ 16, the 98th percentile of IQ equals: µ + 2.05σ = 100 + 2.05(16) = 133
Z-Score for a Value of a Random Variable • The z-score for a value of a random variable is the number of standard deviations that x falls from the mean µ. • It is calculated as:
Example: Finding Your Relative Standing on The SAT • Scores on the verbal or math portion of the SAT are approximately normally distributed with mean µ = 500 and standard deviation σ = 100. The scores range from 200 to 800.
Example: Finding Your Relative Standing on The SAT • If one of your SAT scores was x = 650, how many standard deviations from the mean was it?
Example: Finding Your Relative Standing on The SAT • Find the z-score for x = 650.
Example: Finding Your Relative Standing on The SAT • What percentage of SAT scores was higher than yours? • Find the cumulative probability for the z-score of 1.50 from Table A. • The cumulative probability is 0.9332.