Download
1 / 12
120 likes | 198 Views
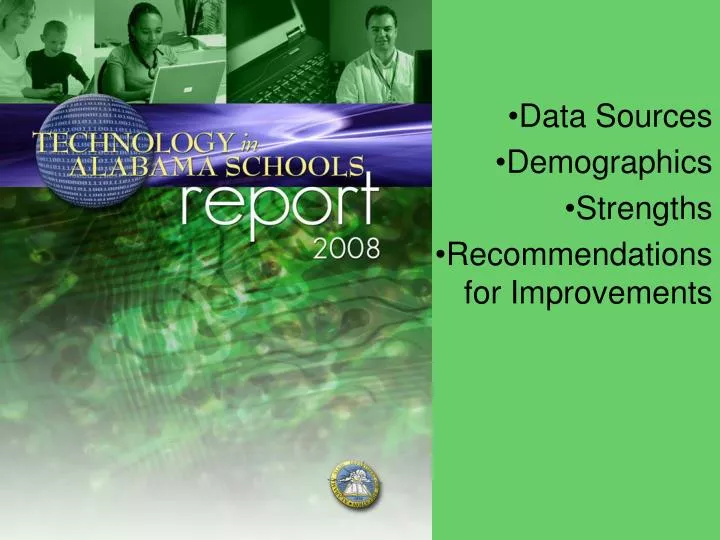
Data Sources Demographics Strengths Recommendations for Improvements. Data Source IMPACT Survey – Teachers, Administrators, Technology Coordinators NetDays Survey Respondents - Teachers, Students, Parents. IMPACT Demographics Teachers – 75%. IMPACT Demographics Administrators – 81%.

E N D
Data Sources Demographics Strengths Recommendations for Improvements
Data Source IMPACT Survey – Teachers, Administrators, Technology Coordinators NetDays Survey Respondents - Teachers, Students, Parents
IMPACT Demographics • Teachers – 75%
IMPACT Demographics • Administrators – 81%
IMPACT Demographics • Technology Coordinator - 100%
NetDays Demographics • All State Board Districts • 27 Systems • 257 Schools
Key Strengths: • Teachers Use Technology for Personal Productivity Teachers Use Technology To Collect Student Data and Monitor and Report Student Progress. • Schools and school districts have the infrastructure and leadership to support technology use. • Students use a variety of sophisticated technologies at home (desktop computers, video games, MP3 or IPods, digital cameras. • Parents are satisfied with their child’s technology program. • Inventory continued to improve in number of computers available to students.
Improvement Areas: • Teachers do not formally assess students’ technology literacy. • Students do not regularly use technology in the learning process. • Parents want teachers to use technology tools more to improve home-to-school communications and student achievement. • Schools are not keeping pace with technologies in schools that will be required for success in the 21st Century.
Summary 56% of Alabama’s teachers using technology for their own productivity, researching resources on the Internet 65% regularly use technology to monitor student progress Students’ use is primarily limited to instructional games (43%) and tutorials (44%)
Recommendations Collecting data, recording grades, and generally monitoring student progress appears to constitute much of a teacher’s time with technology, whereas technologies used by teachers and assigned to students that develop higher order thinking and learning with students are areas for improvement in Alabama’s Classroom.
Summary Alabama parents think their children need technology skills: To do well in school(76%), To succeed in college (75%), and To find a job (74%).