Download
1 / 29
300 likes | 464 Views
Data Sources. Sources , integrati on , qu alit y , error, uncertainty. Data acquisition. Land surveying (geodes y ), GPS Aerial ph oto graphy Satellit e images Laser altimetry Digi t i zing of paper maps Scann ing of paper maps Statistic al data ( e.g. from census bureaus)

E N D
Data Sources Sources, integration, quality, error, uncertainty
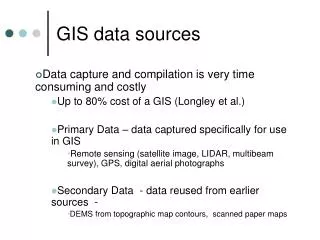
Data acquisition • Land surveying (geodesy), GPS • Aerial photography • Satellite images • Laser altimetry • Digitizingof paper maps • Scanningof paper maps • Statistical data (e.g.from census bureaus) • Surface and soil measurements
Land measurement, GPS • Measuring devices: theodolites, distance measurers, range finders, GPS (for angles, distances and location)Reference systems: • RD-net (Rijksdriehoeksmeting) • GPS-kernnet (415 points) • Field sketchesImportant for attributes (streetnames, whichcrops exactly, etc.) and for verification • GPS: precision of up to a few centimeters • Based on 24 satellites • 3D coordinates
Aerial photography • Most important sourcefor the Topographic Survey (TDN) • Aerial photos are digitized by hand, andinterpreted by the eye • Precision (resolution) of ~15 cm
Satellite images • Measured electromagnetic radiation (reflection) • Of types of surface coveragethe reflected wave lengthsare known approximately (for instance, vegetation reflects much infra-red) • Also called: remote sensing • Resolution Landsat: 30x30 m; SPOT 20x20m or 10x10 monochromatic • EROS pan: 1.8 m, IKONOS: 0.82 m, QuickBird: 0.60 m • Spatial, temporal, spectral resolution
Landsat Thematic Mapper, 30 m resolution, Cape Breton Island
Laser altimetry (LIDAR data) • For elevation data, gives 3D point cloud • Precision ~20cm • Correction is needed
Correction of laser altimetry data Filtering elevation data to remove towns
Digitizingof paper maps • Paper maps are the most important source for digital data • Redraw bounding lines, add attributes • Withdigitizer tablet or table, orheads-up digitising • Line mode orstream mode • After digitizingthe topology must be added
Scanningof paper maps • Convert a mapby a scanner into a pixel image • Automatic interpretation difficult and error-prone checkingand correctionnecessary • Vector scanningexists too
Statistical data • E.g. questionnaires and interviews • Human-geographic of economic-geographic:number of dogs per 1000 households, income, political preference • Usually collected by the CBS, Census Bureau, orby marketing bureaus • Usually mapped as a choropleth map(administrative regions with shades-of-a-color-coded meaning, classified)
Soil measurements • For non-visible data like pollution, temperature, soil type • Choose sampling strategy • Ideal: random sampling • Practice: sampling in easily accessible areas • Additional samples in ‘interesting’ areas 0 5 0 0 9 0 0 0 0
Data source for applications • Buyexisting datafiles, provided they are available and the quality is sufficient • Services to keep information up-to-date, e.g. maintain roads and road blocks in vehicle navigation systems
Data integration • Convert data from two different sources in order to compare, and make analysis possible • Same dateof sources desirable • Same level of aggregation desirable (highest level determines the level of comparison)
Edge matching • Integrationof digitizeddata sets based on adjacent map sheets • Idea: create seamless digital data set
Data quality, I • Precision:number of known decimals,depending on measuring device • Accuracy: absenseof systematic bias(No faultyfine-tuning) both precise accurate neither
Data quality, II • Validitity:degree in which data is relevant for an application (complex geographic variables)E.g.: income for well-being; temperature forgood weather • Reliability:up-to-date, not old for purposeE.g.: data oflast week is out-of-datefor temperature, but not for land cover
Geometric and topologicalquality • Absenceoferror • Presenceof consistenty
Sources of geometricaland topological errors • Digitizing• Integration • Generalization • Raster-vector conversion • Edge-matching
Other sources and problems • Wrongattachment of geometryand attributes • Missing attribute data • Uncertaintyat classification of satellite images • Clouds in satellite images, shadows inaerialphotos • Unknown quality (e.g. precision) of paper mapsused for digitizing: missing metadata • Deformingof papermaps
Dealing with error/uncertainty • Provide metadata (when data collected, how, what equipment) • Visualize uncertainty E.g. classification of satellite images for land cover grass: 0.86 forest: 0.08 water: 0.03 … Confusion:1 - (pmax- psecond) grass: 0.34 forest: 0.31 water: 0.25 …