Download

1 / 26
260 likes | 369 Views
Strategy for seasonal prediction developments at ECMWF. Roberto Buizza, Franco Molteni, Magdalena Balmaseda, Thomas Jung, Linus Magnusson, Kritian Mogensen, Tim Stockdale, Yuhei Takaya* and Frederic Vitart European Centre for Medium-Range Weather Forecasts

E N D
Strategy for seasonal prediction developments at ECMWF Roberto Buizza, Franco Molteni, Magdalena Balmaseda, Thomas Jung, Linus Magnusson, Kritian Mogensen, Tim Stockdale, Yuhei Takaya* and Frederic Vitart European Centre for Medium-Range Weather Forecasts (* Visiting scientist at ECMWF in 2009, now back at CPD of JMA)
Outline • ECMWF current and future seasonal systems S3 and S4 • Recent results from 46-day EPS coupled integrations • Model error simulation schemes • Model improvements (e.g. convection in the tropics, stratosphere), inclusion of a mixed-layer and a dynamical sea-ice model • Conclusions: potential future strategy for seasonal prediction
Atmospheric model Wave model 1. Baseline operational systems (2010) HRES TL1279L91 (d0-10) EPS TL639L62 (d0-10) TL319L62 (d10-15/32) SF TL159L62 (m0-7/12) Atmospheric model Wave model Ocean model Real Time Ocean Analysis ~8 hours Delayed Ocean Analysis ~12 days
1. ECMWF operational system S3 IFS 31R1 1.1 deg. 62 levels HOPE ~ 1.4 deg. lon 1.4/0.3 d. lat. OASIS-2 TESSEL Ens. Forecasts Initial Con. 4-D variational d.a. Gen. of Perturb. System-3 CGCM Multivar. O.I.
1. The new seasonal forecasting system S4 IFS 36R4 0.7/1.1 deg. 91 levels NEMO ~ 1.4 deg. lon 1.4/0.3 d. lat. OASIS-3 H-TESSEL Ens. Forecasts Initial Con. 4-D variational d.a. Gen. of Perturb. System-4 CGCM 3-D v.d.a. (NEMOVAR)
1. System 4: main features It is expected that S4 will improve the quality of seasonal forecasts thanks to the combined contribution of: • A new ocean model: NEMO v3.0 + 3.1 coupling interface: • ORCA-1 configuration (~1-deg. resol., ~0.3 lat. near the equator) • 42 vertical levels, 20 levels with z < 300 m • Better ocean ICs with variational ocean data assimilation (NEMOVAR): • 3-D var with inner and outer loop • Collaboration with CERFACS, UK Met Office, INRIA • First re-analysis (1957-2009), no assim. of sea-level anomalies • Second re-analysis and real-time system including SLA • Better atmospheric model cycle (IFS cycle 36r4): • New physics package, including HTESSEL land-surface scheme, snow model (with EC-Earth), new land surface initialization • Prescribed sea-ice conc. with sampling from recent years
Outline • ECMWF current and future seasonal systems S3 and S4 • Recent results from 46-day EPS coupled integrations • Model error simulation schemes • Model improvements (e.g. convection in the tropics, stratosphere), inclusion of a mixed-layer and a dynamical sea-ice model • Conclusions: potential future strategy for seasonal prediction
2. The MJO and the skill over the NH extra-tropics • The Madden-Julian Oscillation (MJO) is a 40-50-day oscillation with peak activity during NH winter and spring. It is a near-global scale, quasi-periodic eastward moving disturbance in the surface pressure, tropospheric temperature and zonal winds over the equatorial belt. • The MJO is the dominant mode of variability in the tropics in time scales in excess of 1 week but less than 1 season. • The MJO influences the Indian and Australian summer monsoons (Yasunari 1979, Hendon & Liebman 1990). It has an impact on ENSO. Westerly wind bursts produce equatorial trapped Kelvin waves, which have a significant impact on the onset and development of an El-Niňo event (Kessler & McPhaden 1995). It has an impact on tropical storms (Maloney et al 2000, Mo 2000) and on NH weather. • Recent results have indicated that the 32d EPS has an improved description of the MJO and is capable to capture at least part of the tropical/extra-tropical interaction due to the MJO. These improvements supports the potential further extension of the EPS to 46-60 days.
2. The MJO in subsequent IFS cycles ERA40 28R3 29R1 31R1 32R2 These plots show OLR anomalies in ERA-40 (left panel) and in 15d forecasts run (from 29 Dec to 12 Feb) with different model cycles from 28r3 (ope in Oct ‘04) to 35r3 (ope from Sep ‘09 to Jan ‘10). More recent cycles (from 32r2) are better capable to simulate MJO activities. 29/12 05/01 12/01 days 20/01 28/01 04/04 12/02 10/04 04/05 09/06 06/07 32R3 33R1 35R1 35R3 11/07 06/08 09/08 09/09
2. The MJO and the skill over NH in NDJFMA The skill of probabilistic forecasts of 2mT in the upper tercile for cases with MJO-in-ICs and NO-MJO-in-ICs have been compared (1989-2008). Results based on 45 cases show that the skill of weekly average d19-25 is higher if these is an active MJO in the ICs. MJO in ICs BSS(EU)=0.03 NO MJO in ICs BSS(EU)=-0.09 MJO in ICs BSS(NH)=0.04 NO MJO in ICs BSS(NH)=-0.06
2. The MJO and the skill over NH in NDJFMA DAY 12-18 DAY 5-11 MJO in ICs - NO MJO in ICs MJO in ICs - NO MJO in ICs Z500 Z500 Z500 Z500 T850 T850 T850 T850 Precip Precip Precip Precip DAY 19-25 DAY 26-32 MJO in ICs - NO MJO in ICs MJO in ICs - NO MJO in ICs
2. 32d EPS scores over NH (ROCA) Results based on 45 cases (ICs 4 times a year from ‘91 to ’02, 5m) indicate that 32d EPS weekly average probabilistic forecasts of 2mT and MSLP over NH land points have some level of skill up to forecast day 32. This is shown hereafter for the probabilistic prediction of occurrence of upper tercile values. Motivated also by these results, work has continued to investigate whether a 46-day extension could provide skilful forecasts up to 6 weeks ahead. 2mT MSLP TP D5-11 D12-18 D19-25 D26-32 D5-11 D12-18 D19-25 D26-32 D5-11 D12-18 D19-25 D26-32
2. Further extension of the EPS to 46 days? 15-member ensembles starting on the 15th of each month from 1991 to 2007 (1979-2008 for the 15th July starting date) have been integrated for 46 days using the same configuration as the operational monthly forecasts. Results indicate that those forecasts are significantly more skilful than the seasonal forecasts of month 2 issued the same day (15th of the month) Average ROC area for PR(2MT>upper 1/3) computed for all NH land point for DJF. Blue is the SF d30-61 forecast (available on the 15th of the month). Red is the EPS d15-46 forecast, which would also be available on the 15th of the month.
Outline • ECMWF current and future seasonal systems S3 and S4 • Recent results from 46-day EPS coupled integrations • Model error simulation schemes • Model improvements (e.g. convection in the tropics, stratosphere), inclusion of a mixed-layer and a dynamical sea-ice model • Conclusions: potential future strategy for seasonal prediction
3. Stochastic schemes: SPPT Since 1999, ECMWF has been running its ensemble prediction systems with stochastic schemes designed to simulate model error. The first version of the stochastically perturbed parameterized tendency (SPPT) scheme implemented in the EPSS in 1999 was designed to simulate the effect of random model errors due to parameterized physical processes. S3 has been running with this scheme. Since Nov 2010, the EPS has been running with a revised version of SPPT and a stochastic back-scatter scheme (SPBS). The SPPT revisions (implemented in 2009 and 2010) includes: • Perturbations with 3 different spatio-temporal scales and amplitudes • A revised (vertically consistent) treatment of super-saturation • A tighter clipping of the Gaussian distribution (2σ instead of 3σ to address potential numerical instabilities). It is expected that the inclusion of the revised-SPPT and the BS in S4 should improve its reliability.
3. The multi-scale SPPT (in ope EPS since N10) 2000 km 30 d 1000 km 3 d 500 km 6 h
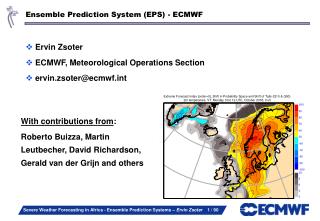
3. SPBS (in ope EPS since N10) Work is continuing to develop a stochastic back-scatter scheme: • Rationale: a fraction of the dissipated energy is backscattered upscale and acts as streamfunction forcing for the resolved-scale flow (Shutts & Palmer 2004, Shutts 2005, Berner et al 2009) • Streamfunction forcing is given by: Backscatter ratio Streamfunction forcing Total dissipation rate Pattern generator
Outline • ECMWF current and future seasonal systems S3 and S4 • Recent results from 46-day EPS coupled integrations • Model error simulation schemes • Model improvements (e.g. convection in the tropics, stratosphere), inclusion of a mixed-layer and a dynamical sea-ice model • Conclusions: potential future strategy for seasonal prediction
4. Tropics and stratosphere (relaxation exps) ECMWF Model Formulation: Relaxation Formulation: • Relaxation coefficient, λ, depends on latitude, longitude and height. • xref is based on (linearly interpolated) analysis fields.
4. Tropics, stratosphere and NH-extra-tropics Day6-Day10 Day16-Day20 Day26+Day30 Relaxing the tropics (middle) leads to a reduction of fc error both over NA and EU. A better representation of the stratosphere (bottom) has also a positive impact over the high-latitudes in the longer forecast range. CON TR-CON STRA-CON (λ=1.0)
4. Mixed-layer model • Y Takaya started implemented the KPP mixed-layer model in the IFS and started the work to assess its impact on the EPS monthly time scale. • Results obtained by Y Takaya (now at JMA) using the KPP model in the tropical band (40°S-40°N) coupled to the atmospheric model grid indicated that in some cases the KPP model improved the simulation of the MJO propagation. 40N 30N 30S 40S
4. Sea-ice modelling Work has started to test the impact of using the Louvain-la-Neuve sea Ice Model (LIM2, http://www.astr.ucl.ac.be/) on long-range integrations. LIM2 is a 2-layer ice model with parameterised ice thickness distribution. Preliminary results indicate that the 8-year average sea-ice extension predicted using LIM2 propagates too far south. IFS Oasis 3 NEMO LIM2 OBS LIM2
Outline • ECMWF current and future seasonal systems S3 and S4 • Recent results from 46-day EPS coupled integrations • Model error simulation schemes • Model improvements (e.g. convection in the tropics, stratosphere), inclusion of a mixed-layer and a dynamical sea-ice model • Conclusions: potential future strategy for seasonal prediction
Conclusions • Recent EPS developments have indicated that the latest model cycles (say since 2008) are more capable to simulate the MJO and to capture the link between the MJO and the extra-tropics. EPS weekly average forecasts of variables such as 2mT and MSLP are skilful up to 4 weeks in advance. EPS d15-46 average fcs issued on the 15th of each month are better than m2 S3 fcs. This suggests that one possible way to generate better monthly outlooks could be to extend the EPS up to 46-60 days. • Work is progressing to assess the impact of using the revised, multi-scale SPPT and the SPBS model error schemes in the seasonal system. This should also lead to seasonal forecast improvements. • Recent relaxation experiments have indicated that improving the tropics (better physics) and the stratosphere simulation can lead to improvements in the NH extra-tropics. This is one of reasons why S4 will use 91 instead of 62 vertical levels and the TOA will be moved from ~5Pa to ~1Pa.
Conclusions Work will continue to further improve the ECMWF seasonal forecasts by: • Implementing the coupled seasonal system 4 (S4) – The new system will use NEMO and NEMOVAR 3D-Var ocean data-assimilation, atmospheric model cycle 36r4 with a better physics and 91 vertical levels with the TOA at 1Pa. • Improving the model error simulation schemes in the EPS and SF – Work is progressing to assess the impact of the revised-SPPT and the SPBS schemes on seasonal forecasts. • Including a dynamical sea-ice model and a mixed-layer model – Work has started to assess whether using the LIM2 dynamical sea-ice model and a mixed-layer model can lead to further improvements. • Merging the EPS and the SF in a Seamless Probabilistic System (SPS) – Once NEMO has been implemented also in the EPS, assess the possibility to merge the EPS and the SF (e.g. by using EPS d15-46 forecast to predict the first next calendar month and then further truncate the resolution). • Increasing the resolution of the ocean model - Assess the impact of using a higher-resolution ocean model (1/4 degree NEMO) in the probabilistic forecasting systems.