Download
1 / 22
220 likes | 233 Views
ANALYSIS OF AGROCLIMATIC SPATIAL AND TEMPORAL VARIABILITY AT FARM SCALE. Simone Orlandini, Anna Dalla Marta , Marco Mancini, Alessio Orlandini Department of Agronomy and Land Management University of Florence.

E N D
ANALYSIS OF AGROCLIMATIC SPATIAL AND TEMPORAL VARIABILITY AT FARM SCALE Simone Orlandini, Anna Dalla Marta, Marco Mancini, Alessio Orlandini Department of Agronomy and Land Management University of Florence WORKSHOP ON CLIMATIC ANALYSIS AND MAPPING FOR AGRICULTURE (14-17 June 2005, Bologna, Italy)
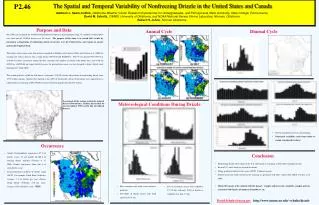
One of the key elements for an efficacious territorial characterization and monitoring is represented by a correct design of the agrometeorological station network. • At the moment, the applied criteria are mainly based on economic costs, accessibility, representativeness of the surrounding vegetation, distance from obstacles and control. WORKSHOP ON CLIMATIC ANALYSIS AND MAPPING FOR AGRICULTURE (14-17 June 2005, Bologna, Italy)
WHERE? MONITORING LENGHT AGROMETEOROLOGICAL STATIONS POSITIONING HOW LONG? 1 2 3 N years 4 WORKSHOP ON CLIMATIC ANALYSIS AND MAPPING FOR AGRICULTURE (14-17 June 2005, Bologna, Italy)
AIMS • Analysis of temperature spatial variability to determine the relationships between neighbouring stations and the causes of the observed variability, in order to identify the criteria for a correct stations positioning • Definition of the minimum length of the monitoring period to obtain a representative description of the relations among the different measuring points WORKSHOP ON CLIMATIC ANALYSIS AND MAPPING FOR AGRICULTURE (14-17 June 2005, Bologna, Italy)
METHODS • The research has been carried on in a small area of about 120 ha, in order to obtain information at farm scale • The approach proposed by Hubbard, based on the analysis of the determination coefficient (R2), has been followed • A temperature data set of 8 years (1996 - 2003) was available for 28 positions WORKSHOP ON CLIMATIC ANALYSIS AND MAPPING FOR AGRICULTURE (14-17 June 2005, Bologna, Italy)
Thermo-hygrometric network “Fattoria Poggio Casciano” WORKSHOP ON CLIMATIC ANALYSIS AND MAPPING FOR AGRICULTURE (14-17 June 2005, Bologna, Italy)
WORKSHOP ON CLIMATIC ANALYSIS AND MAPPING FOR AGRICULTURE (14-17 June 2005, Bologna, Italy)
AVAILABLE LAYERS Altitude Aspect Distance from valleys bottom Slope WORKSHOP ON CLIMATIC ANALYSIS AND MAPPING FOR AGRICULTURE (14-17 June 2005, Bologna, Italy)
SPATIAL VARIABILITY ANALYSIS • Reference station identification - the lowest position (~ 150 m asl) - the most representative • Calculation of R2 between the reference station and the other measuring points • Graphic representation of “variograms” on monthly bases (8 years average) for Tmax, Tmin and Tmean. The R2 values have been distributed as function of: • distance • difference in height • distance from valley bottom • aspect absolute and real values WORKSHOP ON CLIMATIC ANALYSIS AND MAPPING FOR AGRICULTURE (14-17 June 2005, Bologna, Italy)
Belt positioning-absolute values High belt +60 m Medium belt +35 m Reference station position Low belt -35 m Medium belt -60 m High belt WORKSHOP ON CLIMATIC ANALYSIS AND MAPPING FOR AGRICULTURE (14-17 June 2005, Bologna, Italy)
Belt positioning-relative values High belt +20 m Medium belt Reference station position -20 m Low belt WORKSHOP ON CLIMATIC ANALYSIS AND MAPPING FOR AGRICULTURE (14-17 June 2005, Bologna, Italy)
Minimum temperature - altitude WORKSHOP ON CLIMATIC ANALYSIS AND MAPPING FOR AGRICULTURE (14-17 June 2005, Bologna, Italy)
Mean temperature - altitude WORKSHOP ON CLIMATIC ANALYSIS AND MAPPING FOR AGRICULTURE (14-17 June 2005, Bologna, Italy)
Medium belt Low belt High belt Maximum temperature - altitude WORKSHOP ON CLIMATIC ANALYSIS AND MAPPING FOR AGRICULTURE (14-17 June 2005, Bologna, Italy)
Distance from valley bottom Minimum Mean Maximum WORKSHOP ON CLIMATIC ANALYSIS AND MAPPING FOR AGRICULTURE (14-17 June 2005, Bologna, Italy)
T mean Aspect Distance WORKSHOP ON CLIMATIC ANALYSIS AND MAPPING FOR AGRICULTURE (14-17 June 2005, Bologna, Italy)
Minimum temperature R2 WORKSHOP ON CLIMATIC ANALYSIS AND MAPPING FOR AGRICULTURE (14-17 June 2005, Bologna, Italy)
Mean temperature R2 WORKSHOP ON CLIMATIC ANALYSIS AND MAPPING FOR AGRICULTURE (14-17 June 2005, Bologna, Italy)
Maximum temperature R2 WORKSHOP ON CLIMATIC ANALYSIS AND MAPPING FOR AGRICULTURE (14-17 June 2005, Bologna, Italy)
TEMPORAL VARIABILITY ANALYSIS • Calculation of R2 between pairs of stations using average data from a progressively longer period of time (from 1 to 8 years) • Identification of the time period necessary for the temporal variability stabilization of the measured variables, in order to obtain information representative of the differences existing within the study area WORKSHOP ON CLIMATIC ANALYSIS AND MAPPING FOR AGRICULTURE (14-17 June 2005, Bologna, Italy)
November maximum temperature WORKSHOP ON CLIMATIC ANALYSIS AND MAPPING FOR AGRICULTURE (14-17 June 2005, Bologna, Italy)
CONCLUSIONS • The described method has provided important information on the spatial and temporal distribution of temperature at small scale and on criteria to design monitoring network • To complete the analysis and obtain detailed information on the existing variability, other agrometeorological variables have to be considered • The results will represent the basis for the set up of standard protocols for the creation of monitoring networks at farm scale, in order to obtain information without long and complicated preliminary analysis WORKSHOP ON CLIMATIC ANALYSIS AND MAPPING FOR AGRICULTURE (14-17 June 2005, Bologna, Italy)