Download

1 / 18
180 likes | 304 Views
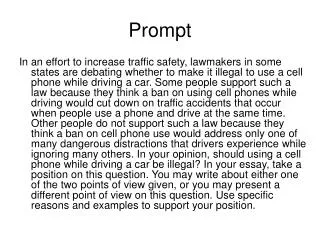
Point of Decision Prompt Campaign. January 17, 2005 And Ongoing. What Was Done. Point of decision prompt (PODP) signs encouraged employees to choose the stairs instead of the elevator

E N D
Point of Decision Prompt Campaign January 17, 2005 And Ongoing
What Was Done • Point of decision prompt (PODP) signs encouraged employees to choose the stairs instead of the elevator • Employee stair, elevator, ramp, and building door use was monitored using infrared sensors and direct observation (via security camera images) • Baseline data on lobby traffic were collected prior to posting the PODP signs and 12 weeks of campaign data were collected after posting the signs
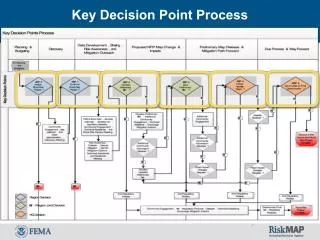
Medtronic Data Collection Points Visitor / Employee Entrance Employee Entrance Elev. Elev. (building) (building) (stair) (stair) (ramp) (ramp) Three infrared sensors in each lobby = sensorlocation = door Parking Ramp
Infrared Sensor Data Problems • For technical reasons there was no sensor at the elevator door. Elevator use was to be calculated by subtracting stair and ramp use from building door use • Sensors registered multiple data captures per second between 10 am and midnight but not at other times of the day • Door movement greatly affected sensor counts • Due to sensor counts of door movement, we were unable to estimate elevator use
Sensors Registered Multiple Captures Per Second • Between midnight and 10 am a sensor only recorded one data capture per second. Between 10 am and midnight a sensor recorded up to 5 data captures per second. • This pattern occurred on all sensors, 7 days a week, from the first to the last day of data collection. • We were unable to ascertain the reason for the multiple data captures.
Visitor/Employee Building SensorNumber of Seconds with Recorded Activity
Door movement greatly affected sensor counts • Between 7 and 9 am the building entrance door was propped open for the employee entrance but not for the visitor/employee entrance • Building door counts are greatly reduced between 7 to 9 am for the employee entrance
Visitor/Employee EntranceSensor Counts during PODP Campaign* by Time of Day Building door NOT propped open * Data are from 1/17/2005 to 4/14/2005 excluding 1/28/2005 (technical problems) and 2/21/2005 (holiday)
Employee EntranceSensor Counts during PODP Campaign* by Time of Day Building door propped open Notice building counts are reduced * Data are from 1/17/2005 to 4/14/2005 excluding 1/28/2005 (technical problems) and 2/21/2005 (holiday)
Unable to Estimate Elevator Use • Because of heavier traffic through the building door, the counts were reduced more than were the counts for stair or ramp doors which had less traffic • Stair plus ramp use counts were about equal to or slightly greater than building door counts • We could not estimate elevator use by subtracting stair and ramp counts from building counts
PODP Campaign Evaluation Because of problems with the sensor data, data from the security cameras were used to evaluate the effectiveness of the PODP campaign.
Camera Data • Data were collected from the employee entrance only. • Data were collected for elevator, stair, and ramp use. Traffic through the building door was calculated as the sum of elevator, stair, and door traffic. • Data were collected weekdays between the hours of 6 to 10 am and between 3 to 7 pm.
BaselineEmployee Entrance Camera Counts* by Time of Day Almost twice as many people used the stairs as used the elevator before the PODP campaign * Baseline consists of one week of data (1/10/2005 – 1/14/2005) prior to PODP campaign.
PODP Campaign Employee Entrance Camera Counts* by Time of Day * Data are from 1/17/2005 to 4/8/2005 excluding 2/21/2005 (holiday)
Increase in Use of Stairs • There was increased choice to use stairs between 8 to 9 am and between 4 to 6 pm • Full increase in stair use didn’t occur until the second week of the PODP campaign • Ramp use stayed constant. The PODP campaign did not reduce ramp use.
Stair Use as Percent of People Taking Either Stairs or Elevator by Time of Day Increase in choice to use stairs rather than elevator
Stair Use as Percent of People Taking Either Stairs or Elevator by Week Baseline Rate
PODP Campaign Results • Baseline 64.9% chose stairs and 35.1% chose elevator. • PODP campaign, weeks 2 through 11, 69.7% chose stairs and 30.3% chose elevator. • (35.1% - 30.3%) / 35.1% = 13.7% of elevator users at baseline switched to stair use during the PODP campaign.