Download
1 / 40
400 likes | 687 Views
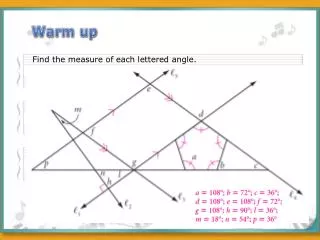
Warm Up For each translation of the point (–2, 5), give the coordinates of the translated point. (–2, –1). 1. 6 units down. 2. 3 units right. (1, 5). For each function, evaluate f (–2), f (0), and f (3). 3. f ( x ) = x 2 + 2 x + 6. 6; 6; 21. 4. f ( x ) = 2 x 2 – 5 x + 1.

E N D
Warm Up For each translation of the point (–2, 5), give the coordinates of the translated point. (–2, –1) 1. 6 units down 2. 3 units right (1, 5) For each function, evaluate f(–2), f(0), and f(3). 3.f(x) = x2 + 2x + 6 6; 6; 21 4.f(x) = 2x2 – 5x + 1 19; 1; 4
Objectives Transform quadratic functions. Describe the effects of changes in the coefficients of y = a(x – h)2 + k.
Vocabulary quadratic function parabola vertex of a parabola vertex form
In Chapters 2 and 3, you studied linear functions of the form f(x) = mx + b. A quadratic function is a function that can be written in the form of f(x) = a (x – h)2 + k (a ≠ 0). In a quadratic function, the variable is always squared. The table shows the linear and quadratic parent functions.
Notice that the graph of the parent function f(x) = x2 is a U-shaped curve called a parabola. As with other functions, you can graph a quadratic function by plotting points with coordinates that make the equation true.
Example 1: Graphing Quadratic Functions Using a Table Graph f(x) = x2 – 4x + 3 by using a table. Make a table. Plot enough ordered pairs to see both sides of the curve.
Example 1 Continued f(x) = x2 – 4x + 3 • • • • •
Check It Out! Example 1 Graph g(x) = –x2 + 6x – 8 by using a table. Make a table. Plot enough ordered pairs to see both sides of the curve.
Check It Out! Example 1 Continued f(x) = –x2 + 6x – 8 • • • • •
You can also graph quadratic functions by applying transformations to the parent function f(x) = x2. Transforming quadratic functions is similar to transforming linear functions (Lesson 2-6).
h k Example 2A: Translating Quadratic Functions Use the graph of f(x) = x2 as a guide, describe the transformations and then graph each function. g(x) = (x – 2)2 + 4 Identify h and k. g(x) = (x – 2)2 + 4 Because h = 2, the graph is translated 2units right. Because k = 4, the graph is translated 4units up. Therefore, g is f translated 2 units right and 4 units up.
h k Example 2B: Translating Quadratic Functions Use the graph of f(x) = x2 as a guide, describe the transformations and then graph each function. g(x) = (x + 2)2 – 3 Identify h and k. g(x) = (x – (–2))2 + (–3) Because h = –2, the graph is translated 2units left. Because k = –3, the graph is translated 3units down. Therefore, g is f translated 2 units left and 4 units down.
k Check It Out! Example 2a Using the graph of f(x) = x2 as a guide, describe the transformations and then graph each function. g(x) = x2 – 5 Identify h and k. g(x) = x2 – 5 Because h = 0, the graph is not translated horizontally. Because k = –5, the graph is translated 5units down. Therefore, g is f is translated 5units down.
h k Check It Out! Example 2b Use the graph of f(x) =x2 as a guide, describe the transformations and then graph each function. g(x) = (x + 3)2 – 2 Identify h and k. g(x) = (x – (–3))2 + (–2) Because h = –3, the graph is translated 3 units left. Because k = –2, the graph is translated 2units down. Therefore, g is f translated 3 units left and 2 units down.
Recall that functions can also be reflected, stretched, or compressed.
Because |a| = , g is a vertical compression of f by a factor of . Example 3A: Reflecting, Stretching, and Compressing Quadratic Functions Using the graph of f(x) = x2 as a guide, describe the transformations and then graph each function. 1 ( ) =- 2 g x x 4 Because a is negative, g is a reflection of f across the x-axis.
Because b = , g is a horizontal compression of f by a factor of . Example 3B: Reflecting, Stretching, and Compressing Quadratic Functions Using the graph of f(x) = x2 as a guide, describe the transformations and then graph each function. g(x) =(3x)2
Because b = , g is a horizontal compression of f by a factor of . Check It Out! Example 3a Using the graph of f(x) = x2 as a guide, describe the transformations and then graph each function. g(x) =(2x)2
g(x) = – x2 Because |a| = , g is a vertical compression of f by a factor of . Check It Out! Example 3b Using the graph of f(x) = x2 as a guide, describe the transformations and then graph each function. Because a is negative, g is a reflection of f across the x-axis.
If a parabola opens upward, it has a lowest point. If a parabola opens downward, it has a highest point. This lowest or highest point is the vertex of the parabola. The parent function f(x) = x2 has its vertex at the origin. You can identify the vertex of other quadratic functions by analyzing the function in vertex form. The vertex form of a quadratic function is f(x) = a(x – h)2 + k, where a, h, and k are constants.
Helpful Hint When the quadratic parent function f(x) = x2 is written in vertex form, y = a(x – h)2 + k, a = 1, h = 0, and k = 0. Because the vertex is translated h horizontal units and kvertical from the origin, the vertex of the parabola is at (h, k).
4 4 = Vertical stretch by : a 3 3 Example 4: Writing Transformed Quadratic Functions Use the description to write the quadratic function in vertex form. The parent function f(x) = x2 is vertically stretched by a factor of and then translated 2 units left and 5 units down to create g. Step 1 Identify how each transformation affects the constant in vertex form. Translation 2 units left: h = –2 Translation 5 units down: k = –5
= (x – (–2))2 + (–5) Substitute for a, –2 for h, and –5 for k. = (x + 2)2 – 5 g(x) = (x + 2)2 – 5 Example 4: Writing Transformed Quadratic Functions Step 2 Write the transformed function. g(x) =a(x – h)2 + k Vertex form of a quadratic function Simplify.
f g CheckGraph both functions on a graphing calculator. Enter f as Y1, and g as Y2.The graph indicates the identified transformations.
The parent function f(x) = x2 is vertically compressed by a factor of and then translated 2 units right and 4 units down to create g. Vertical compression by : a = Check It Out! Example 4a Use the description to write the quadratic function in vertex form. Step 1 Identify how each transformation affects the constant in vertex form. Translation 2 units right: h = 2 Translation 4 units down: k = –4
= (x – 2)2 – 4 = (x – 2)2 + (–4) Substitute for a, 2 for h, and –4 for k. g(x) = (x – 2)2 – 4 Check It Out! Example 4a Continued Step 2 Write the transformed function. g(x) =a(x – h)2 + k Vertex form of a quadratic function Simplify.
f g Check It Out! Example 4a Continued CheckGraph both functions on a graphing calculator. Enter f as Y1, and g as Y2.The graph indicates the identified transformations.
Check It Out! Example 4b Use the description to write the quadratic function in vertex form. The parent function f(x) = x2 is reflected across the x-axis and translated 5 units left and 1 unit up to create g. Step 1 Identify how each transformation affects the constant in vertex form. Reflected across the x-axis: a is negative Translation 5 units left: h = –5 Translation 1 unit up: k = 1
Check It Out! Example 4b Continued Step 2 Write the transformed function. g(x) =a(x – h)2 + k Vertex form of a quadratic function = –(x –(–5)2 + (1) Substitute –1 for a, –5 for h, and 1 for k. = –(x +5)2 + 1 Simplify. g(x) =–(x +5)2 + 1
f g Check It Out! Example 4b Continued CheckGraph both functions on a graphing calculator. Enter f as Y1, and g as Y2.The graph indicates the identified transformations.
Example 5: Scientific Application On Earth, the distance d in meters that a dropped object falls in t seconds is approximated by d(t)= 4.9t2.On the moon, the corresponding function is dm(t)= 0.8t2. What kind of transformation describes this change from d(t)= 4.9t2, and what does the transformation mean? Examine both functions in vertex form. dm(t)= 0.8(t –0)2 + 0 d(t)= 4.9(t –0)2 + 0
a from dm(t) 0.8 0.16 = a from d(t) 4.9 Example 5 Continued The value of a has decreased from 4.9 to 0.8. The decrease indicates a vertical compression. Find the compression factor by comparing the new a-value to the old a-value. The function dm represents a vertical compression of d by a factor of approximately 0.16. Because the value of each function approximates the time it takes an object to fall, an object dropped from the moon falls about 0.16 times as fast as an object dropped on Earth.
15 d dm 0 15 0 Example 5 Continued CheckGraph both functions on a graphing calculator. The graph of dm appears to be vertically compressed compared with the graph of d.
Check It Out! Example 5 The minimum braking distance d in feet for a vehicle on dry concrete is approximated by the function (v) = 0.045v2, where v is the vehicle’s speed in miles per hour. The minimum braking distance dn in feet for avehicle with new tires at optimal inflation is dn(v) = 0.039v2, where v is the vehicle’s speed in miles per hour. What kind of transformation describes this change from d(v) = 0.045v2, and what does this transformation mean?
a from dn(t) 0.039 13 = = a from d(v) 0.045 15 Check It Out! Example 5 Continued Examine both functions in vertex form. d(v)= 0.045(t –0)2 + 0 dn(t)= 0.039(t –0)2 + 0 The value of a has decreased from 0.045 to 0.039. The decrease indicates a vertical compression. Find the compression factor by comparing the new a-value to the old a-value.
The function dn represents a vertical compression of d by a factor of . The braking distance will be less with optimally inflated new tires than with tires having more wear. 15 d dn 0 15 0 Check It Out! Example 5 Continued CheckGraph both functions on a graphing calculator. The graph of dn appears to be vertically compressed compared with the graph of d.
Lesson Quiz: Part I 1. Graph f(x) = x2 + 3x – 1 by using a table.
g is f reflected across x-axis, vertically compressed by a factor of , and translated 1 unit left. Lesson Quiz: Part II 2. Using the graph of f(x) = x2 as a guide, describe the transformations, and then graph g(x) = (x + 1)2.
Lesson Quiz: Part III 3. The parent function f(x) = x2 is vertically stretched by a factor of 3 and translated 4 units right and 2 units up to create g. Write g in vertex form. g(x) = 3(x – 4)2 + 2